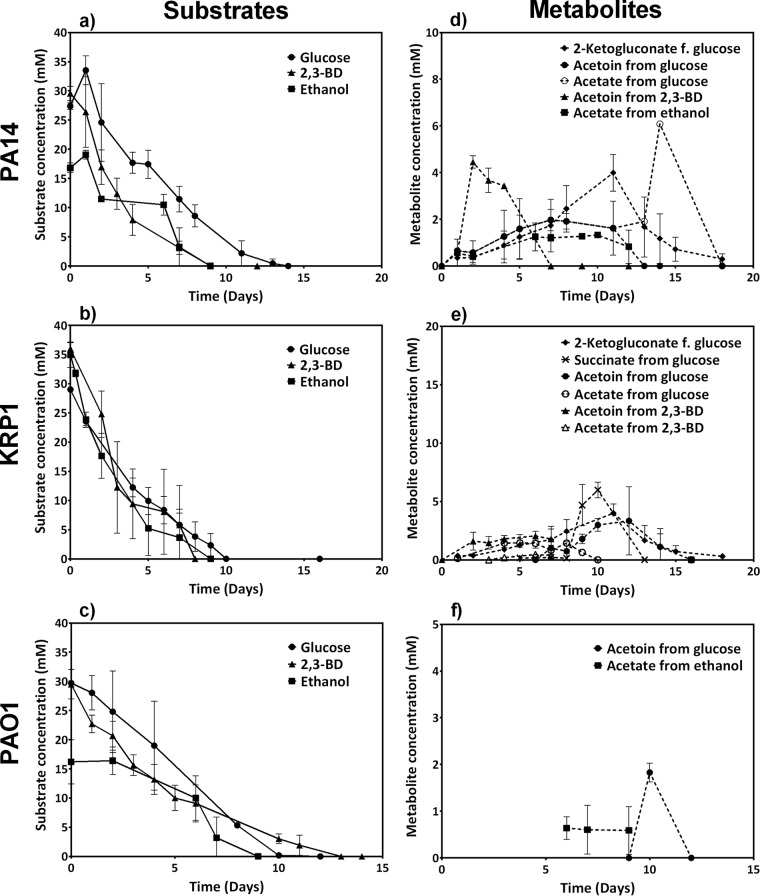
FIG 1.
Carbon substrate consumption (a, b, and c) and metabolite formation time profiles (d, e, and f) for three P. aeruginosa strains in oxygen-limited bioelectrochemical experiments. All data are means and standard deviations for three biological replicates, except those for KRP1 with 2,3-BD, which include only duplicates. The lower reported concentrations of ethanol for PAO1 (the initial concentration was also 30 mM) are due to strong evaporation during sampling and HPLC analysis.

