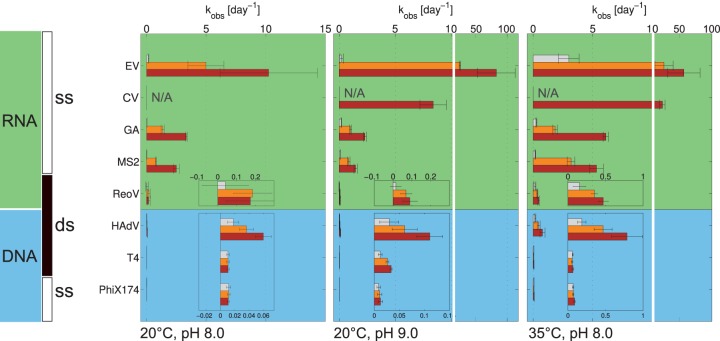
FIG 1.
Comparison of kobs values for all viruses tested at pH 8/20°C, pH 9/20°C, and pH 8/35°C. The gray, orange, and brown bars correspond to intended {NH3(aq)} of approximately 0, 20, and 40 mmol liter−1, respectively. The measured {NH3(aq)} can be found in Table S1 in the supplemental material. The error bars depict the 95% confidence intervals associated with kobs values. N/A, not available.

