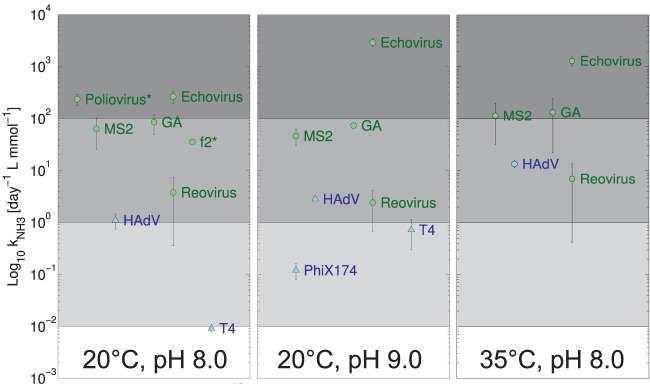
FIG 2.
Dependence of kNH3 on temperature and pH. At pH 8 and 20°C, additional data for f2 and poliovirus (indicated by *) were determined from the work of Burge et al. (57). The error bars depict the 95% confidence interval associated with kNH3 values. Data points associated with the inactivation of ΦX174 and T4 at pH 8.0 and temperatures of 20 and 35°C that were not significantly different from zero were omitted (see Table S4 in the supplemental material).

