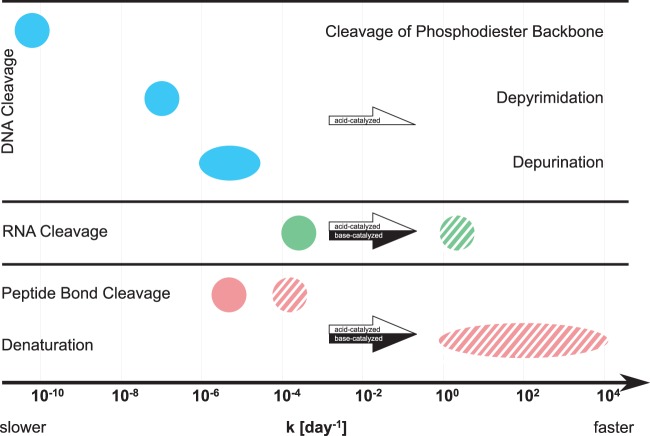
FIG 5.
Summary and comparison of reported DNA, RNA, and protein degradation rate constants. Data refer to degradation at pH 7/37°C (filled symbols) and at pH 11/37°C (striped symbols), and were obtained from the literature (for references and exact numbers, see Table S5 in the supplemental material). The rate for spontaneous cleavage of the phosphodiester backbone corresponds to pH 7/25°C. The arrows indicate the direction of change of the rate constants upon changes in pH conditions (white for acid catalyzed, black for base catalyzed).

