Figure 1.

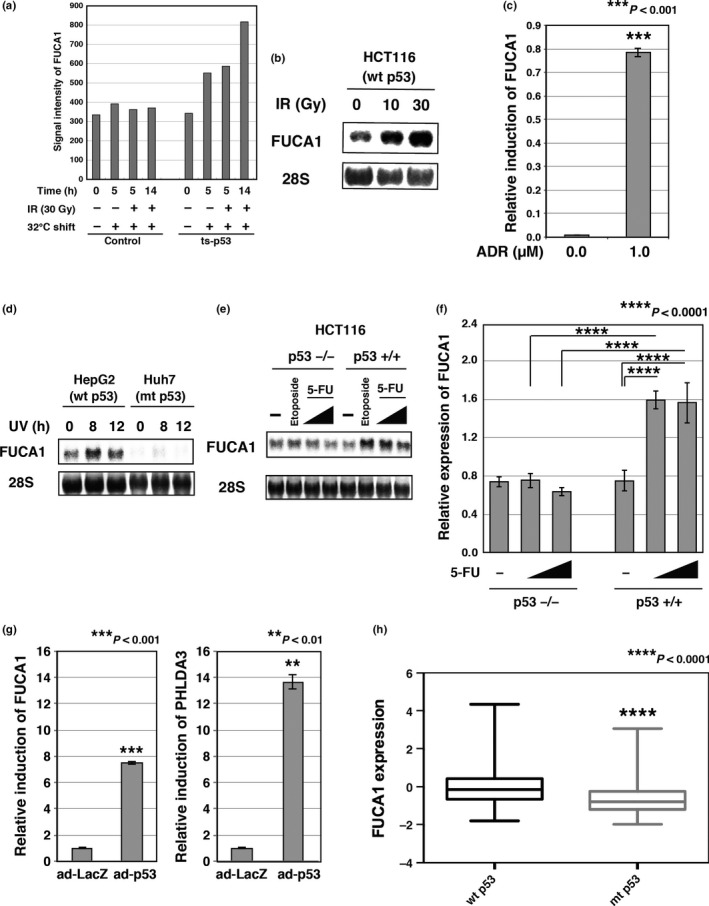
FUCA1 is a p53‐inducible gene. (a) FUCA1 expression was analyzed by microarray analysis. Temperature‐sensitive, p53‐expressing Saos2 cells (ts‐p53) were tested for FUCA1 induction after temperature shift to the permissive temperature with or without γ‐ray irradiation (IR). Cells were subjected to γ‐ray irradiation (30 Gy) 2 h after temperature shift to 32°C. Cells were collected 5 or 14 h post‐temperature shift. (b) HCT116 p53+/+ cells were subjected to γ‐ray irradiation (10 Gy or 30 Gy). Cells were collected 18 h post‐temperature shift. FUCA1 expression was analyzed by Northern blotting. (c) MRC5 cells were subjected to adriamycin (ADR; 1 μM) treatment. Cells were harvested 24 h post‐treatment. FUCA1 expression was analyzed by quantitative RT‐PCR. The mRNA levels of FUCA1 were normalized to GAPDH mRNA levels. (d) HepG2 or Huh7 cells were subjected to UV treatment (45 J/m2). Cells were collected at the indicated time points post‐treatment. FUCA1 expression was analyzed by Northern blotting. (e) HCT116 p53+/+ or p53−/− cells were subjected to etoposide (20 mM) or 5‐fluorouracil (5‐FU) (0.13 or 0.38 mM) treatment. Cells were collected 21 h post‐treatment. FUCA1 expression was analyzed by Northern blotting. (f) HCT116 p53+/+ or p53−/− cells were subjected to 5‐FU (0.38 or 0.76 mM) treatment for 18 h. FUCA1 expression was analyzed by quantitative RT‐PCR. mRNA levels of FUCA1 were normalized to GAPDH mRNA levels. (g) HeLa cells were infected with an adenovirus expressing p53 (ad‐p53) or control LacZ (ad‐LacZ). Cells were harvested 48 h post‐infection. FUCA1 and PHLDA3 expression was analyzed by quantitative RT‐PCR. mRNA levels of FUCA1 and PHLDA3 were normalized to GAPDH mRNA levels. (h) Using the cBioPortal database, FUCA1 expression and the p53 status of breast invasive carcinoma were obtained.39 In total, 971 samples were analyzed. P‐values was calculated using the Mann–Whitney U‐test (P < 0.0001). mt, mutant.
