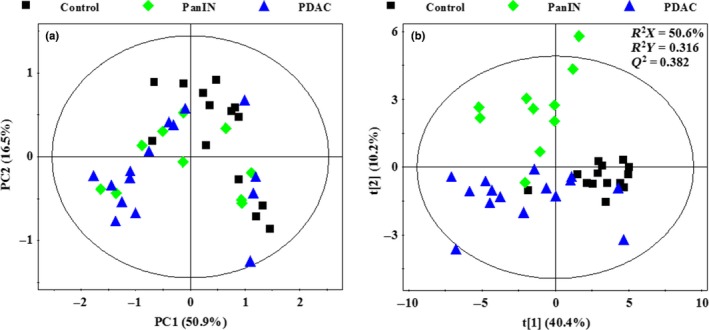
Figure 3.

(a) Principal component analysis scores plot based on 1H NOESYPR1D nuclear magnetic resonance (NMR) spectra of control (■), pancreatic intraepithelial neoplasia (PanIN) ( ), PDAC (
 ). (b) PLS‐DA scores plot based on 1H NOESYPR1D NMR spectra of control (■), PanIN (
 ), PDAC (
 ).
).
