
Figure 4.
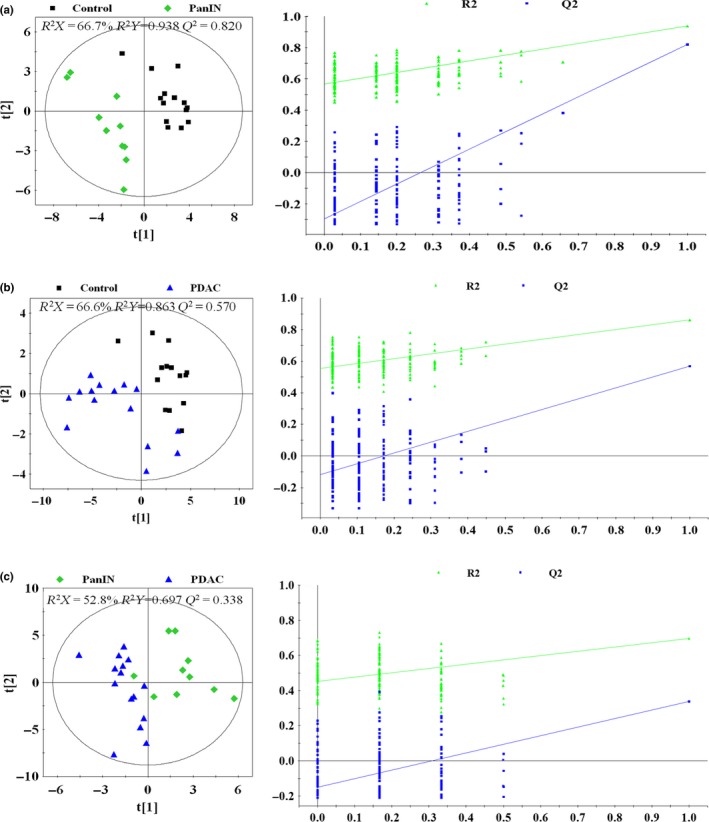
PLS‐DA scores plots (left panels) and plots of permutation tests (n = 200) of PLS‐DA (right panels) based on 1H NOESYPR1D nuclear magnetic resonance (NMR) spectra of aqueous extracts from normal Sprague–Dawley (SD) rat pancreas (control, black box ■), pancreatic intraepithelial neoplasia (pancreatic intraepithelial neoplasia [PanIN], green diamond  and SD rat pancreatic ductal adenocarcinoma (pancreatic ductal adenocarcinoma [PDAC], blue triangle
  ). (a) Control versus PanIN; (b) control versus PDAC; (c) PanIN versus PDAC.