
Figure 5.
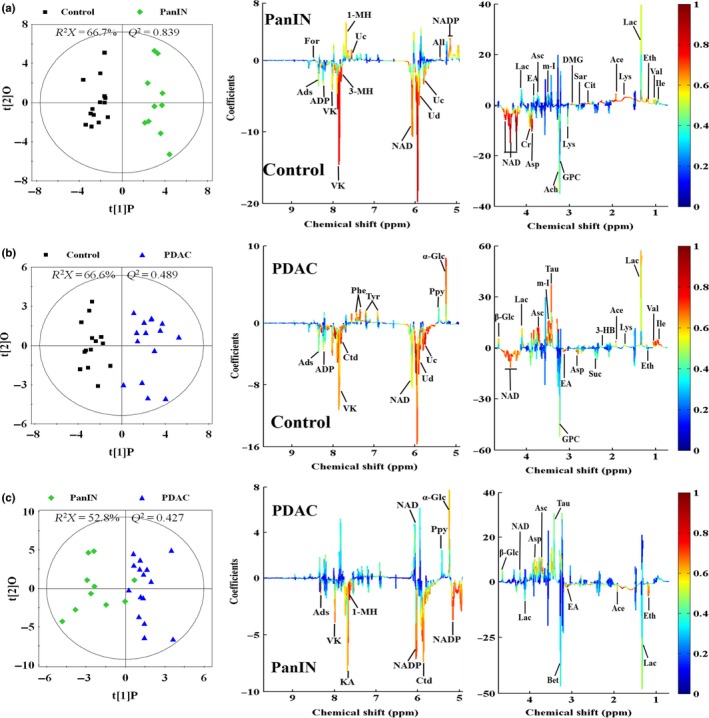
OPLS‐DA scores plots (left panels) derived from 1H nuclear magnetic resonance (NMR) spectra of aqueous extracts and corresponding coefficient loading plots (middle and right panels) from normal Sprague–Dawley rat pancreas (control, black box ■), pancreatic intraepithelial neoplasia (pancreatic intraepithelial neoplasia [PanIN], green diamond  ) and SD rat pancreatic ductal adenocarcinoma (pancreatic ductal adenocarcinoma [PDAC], blue triangle
  ). (a) Control versus PanIN; (b) control versus PDAC; (c) PanIN versus PDAC. The color map shows the significance of metabolites variations between the two classes. Keys of the assignments were shown in Figure 2.