Figure 4.

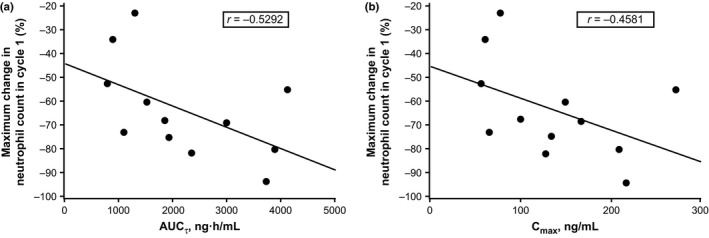
Relationship between change in absolute neutrophil count and pharmacokinetic parameters area under the plasma concentration–time curve over dosing interval (AUC τ) (a) and maximum plasma concentration (Cmax) (b).

Relationship between change in absolute neutrophil count and pharmacokinetic parameters area under the plasma concentration–time curve over dosing interval (AUC τ) (a) and maximum plasma concentration (Cmax) (b).