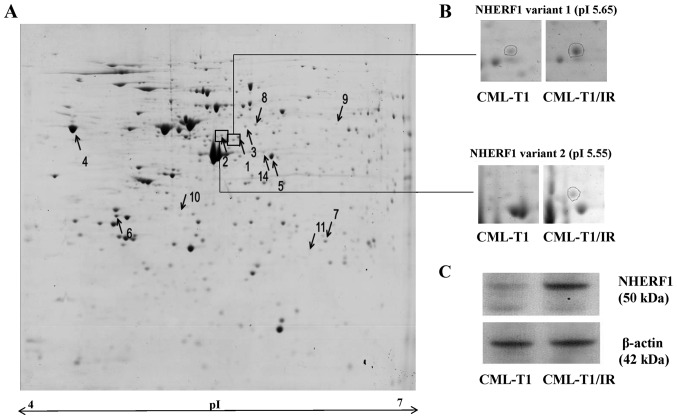
Figure 2.
2-DE analysis of CML-T1/IR and CML-T1 cells. (A) 2-DE gel from the CML-T1/IR cells with differentially expressed proteins indicated by arrows with numbers (↑ upregulated, ↓ downregulated). (B) Two protein variants of NHERF1 were detected as upregulated in the imatinib-resistant CML-T1/IR cells. (C) Verification of altered NHERF1 expression in the total cell lysates of CML-T1 and CML-T1/IR cells by western blot analysis revealed a 2.6-fold increase in the expression of NHERF1 in the CML-T1/IR cells, as quantified by Quantity One software (Bio-Rad, Inc.) based on more than three biological replicates, each performed in three technical replicates.

