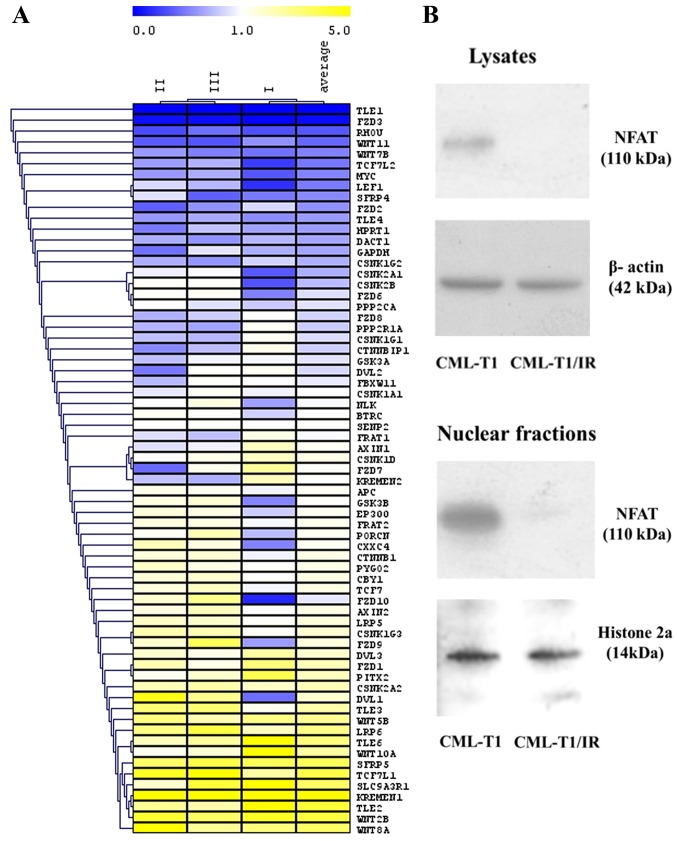
Figure 6.
Changes in gene expression of the Wnt signaling pathway and immunodetection of NFAT by western blot analysis in CML-T1 and CML-T1/IR cells. (A) The heatmap shows genes whose mRNA expression was downregulated (blue) or upregulated (yellow) in the CML-T1/IR cells compared to the CML-T1 cells. (B) NFAT protein expression as determined by western blot analysis in the cell lysates and the nuclei of the CML-T1 and CML-T1/IR cells.

