Figure 1.
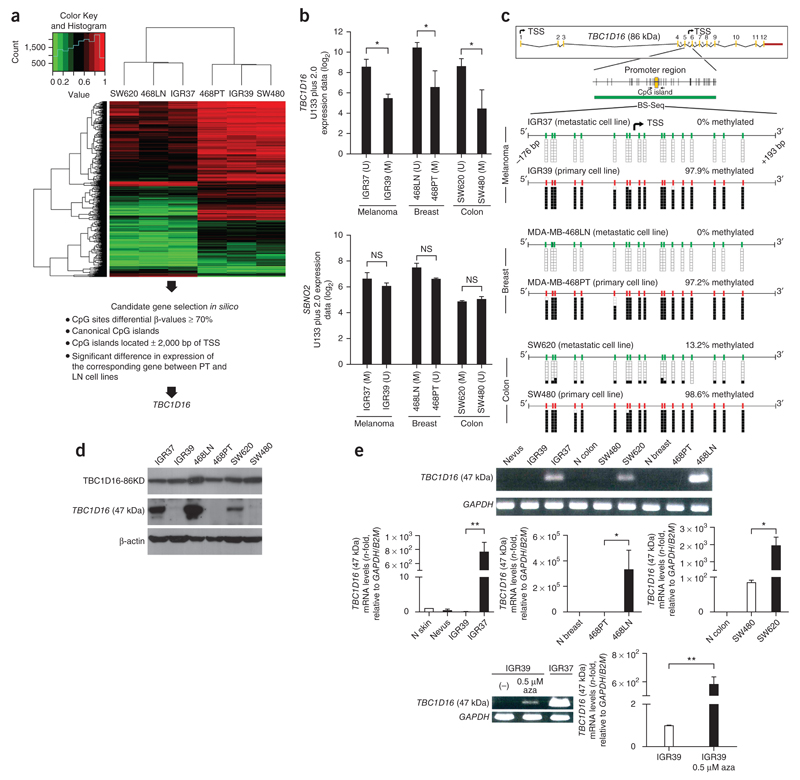
DNA hypomethylation-associated transcriptional activation of a TBC1D16 cryptic isoform in metastatic cancer cells. (a) DNA methylation heatmap clustering of 2,620 CpG sites showing DNA methylation events that distinguish primary (IGR39, MDA-MB-468PT and SW480) or metastatic-derived cell lines (IGR37, MDA-MB-468LN and SW620). (b) Representation of the correlation between DNA methylation microarray data and gene expression microarray values for TBC1D16 and SBNO2. Expression is represented as the average intensity of three probes for TBC1D16 and two probes for SBNO2. (c) Genomic structure of TBC1D16. Transcription start sites (TSSs) of the isoforms are denoted by small black arrows. Locations of CpG islands (green bars) and designed bisulfite sequencing primers (black horizontal arrows) are shown. Bisulfite genomic sequencing was carried out in eight individual clones. The presence of a methylated or unmethylated cytosine is indicated by a black or white square, respectively. (d) Protein expression levels for the TBC1D16-47KD and TBC1D16-86KD isoforms analyzed by western blot in the paired primary/metastasis cancer cell lines. (e) Conventional (top) and quantitative RT-PCR (middle) analyses of TBC1D16 (47 kDa) expression in paired primary and metastasis cancer cell lines and normal tissues. Bottom, reactivation of the TBC1D16 (47 kDa) transcript upon use of the DNA demethylating agent 5-aza-2′-deoxycytidine (aza). NS, nonsignificant; *P < 0.05; **P < 0.01, using Student’s t-test. Error bars show means ± s.d.

