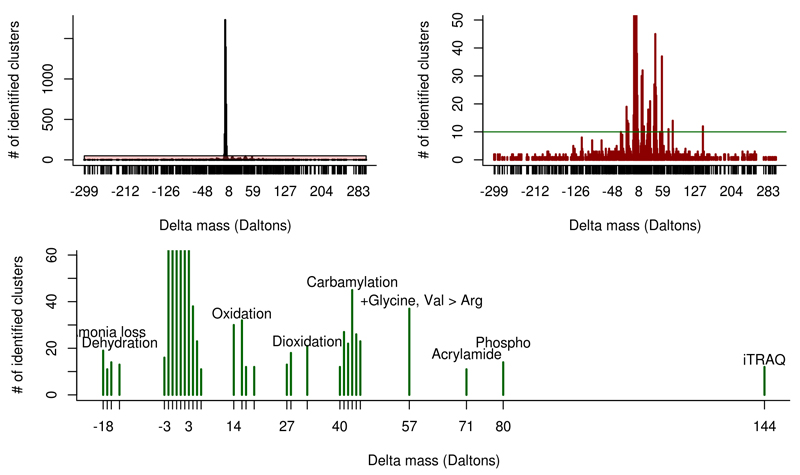
Figure 5.
Summary of results for the analysis of human clusters containing only unidentified spectra. The vast majority of delta masses observed in the open modification search were between -2 and +4 Da (top left panel). After adjusting the y-axis it becomes apparent that several other delta masses were observed at high frequency (top right panel). When limiting these delta masses to only masses that were observed at least for ten different clusters, the vast majority of delta masses could be mapped to known PTMs as well as to one potential amino acid substitution (lower panel). For the complete list of the found delta masses see Supplementary Table 4.

