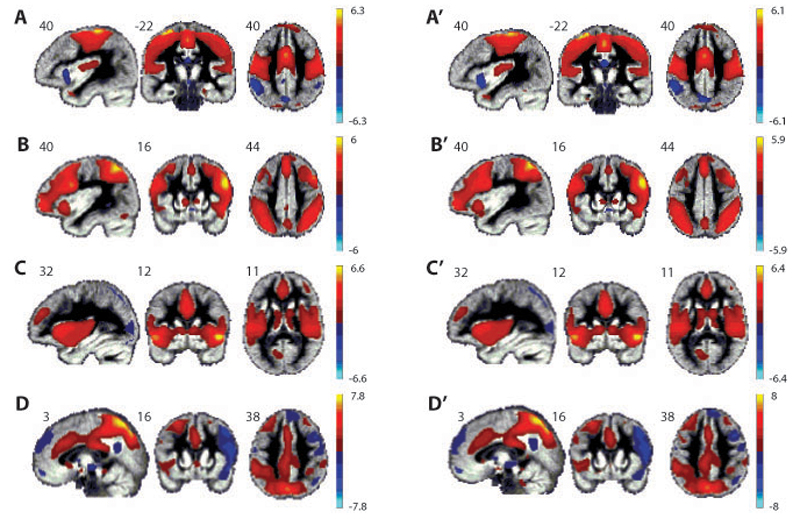
Figure 3.2.
Spatial maps of the components resulting from the sICA that are spatially correlated with the shared circuits mask. Components A, B, C and D were derived from the sham cTBS resting-state data and A’, B’, C’ and D’ were derived from the active cTBS resting-state data. Values in each spatial map represent the normalized correlation of each voxel with the estimated time course of the corresponding component thresholded at -1≤z≤1.

