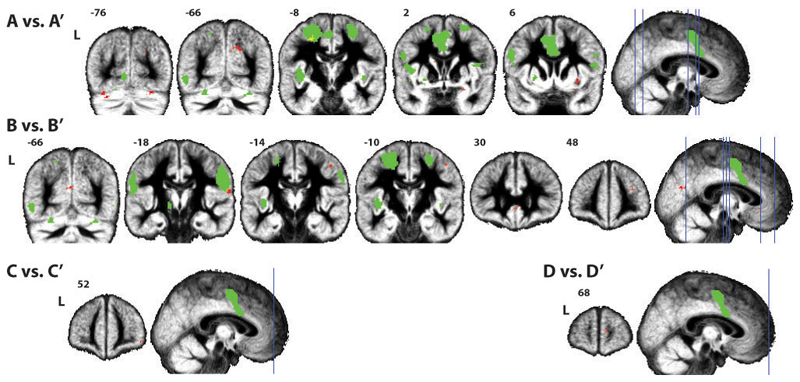
Figure 3.3.
Results from the permutation test comparing the spatial maps of all four components. In green the shared circuits mask and in red (or yellow whenever there is an overlap) the clusters where voxels show significant differences between the spatial maps of the sham and active cTBS sessions. Results are FDR-corrected for both voxel-wise and test-wise multiple comparisons.

