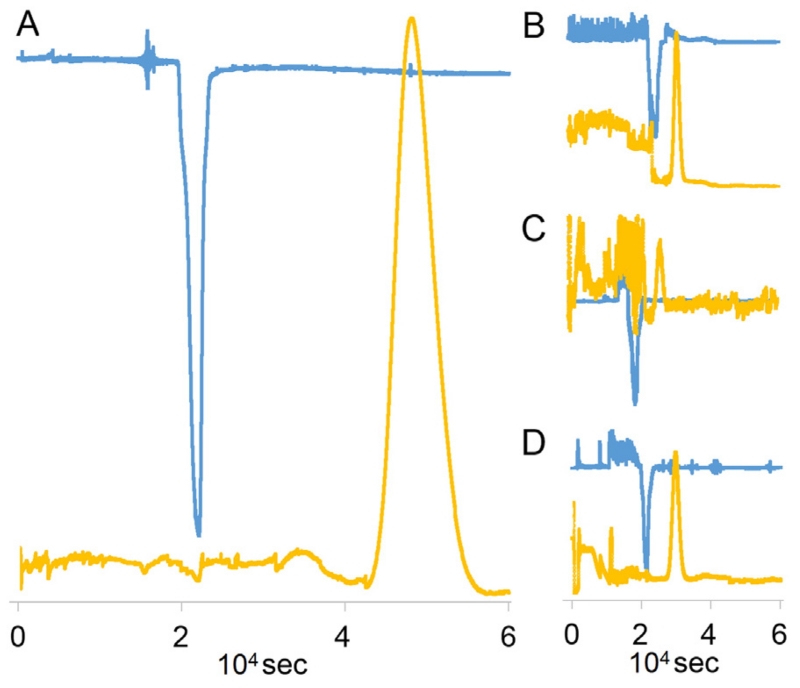
Fig. 2.
The real time parameters (UV and PMA) were determined by the CherryOne operating system. The four plots (A, B, C and D) stem from different CCS operations. A shows the behavior of GCWat-rutin solution in EBuWat (6:4:10, v/v). B reflects the behavior of GCWat-quercetin solution in HEMWat (3:7:5:5, v/v). C shows the behavior of GCWat-kaempferol solution in HEMWat (4:6:5:5, v/v). D demonstrates the behavior of GCWat-daidzein solution in HEMWat (3:7:5:5, v/v). The dispersion signals represented PMA values and the peak signals represented UV absorption. The x-axis exhibited the operation time.

