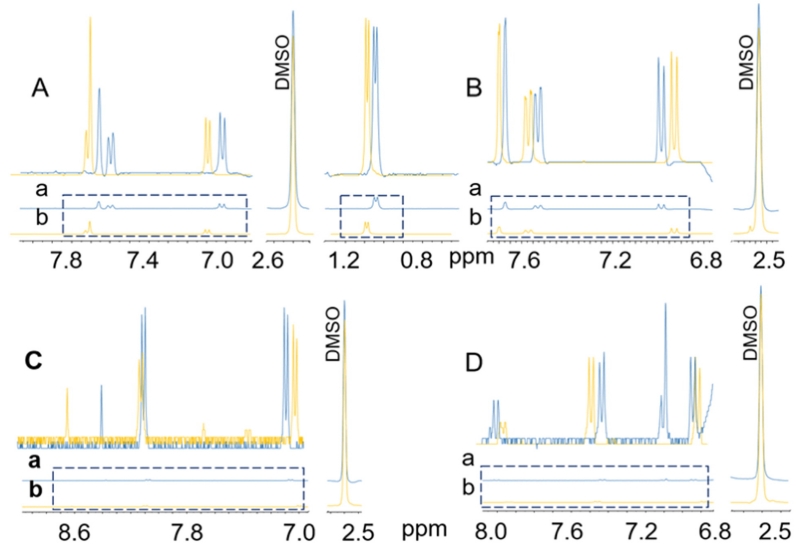
Fig. 7.
The qHNMR spectra used for calculation of the recovery (%) using DMSO solvent signal area as internal calibrant standard. (a) the aliquot positive control, in blue. (b) the recovered test sample, in yellow. A, B, C and D represent rutin, quercetin, kaempferol, and daidzein, respectively. (For interpretation of the references to color in this figure legend, the reader is referred to the web version of this article.)

