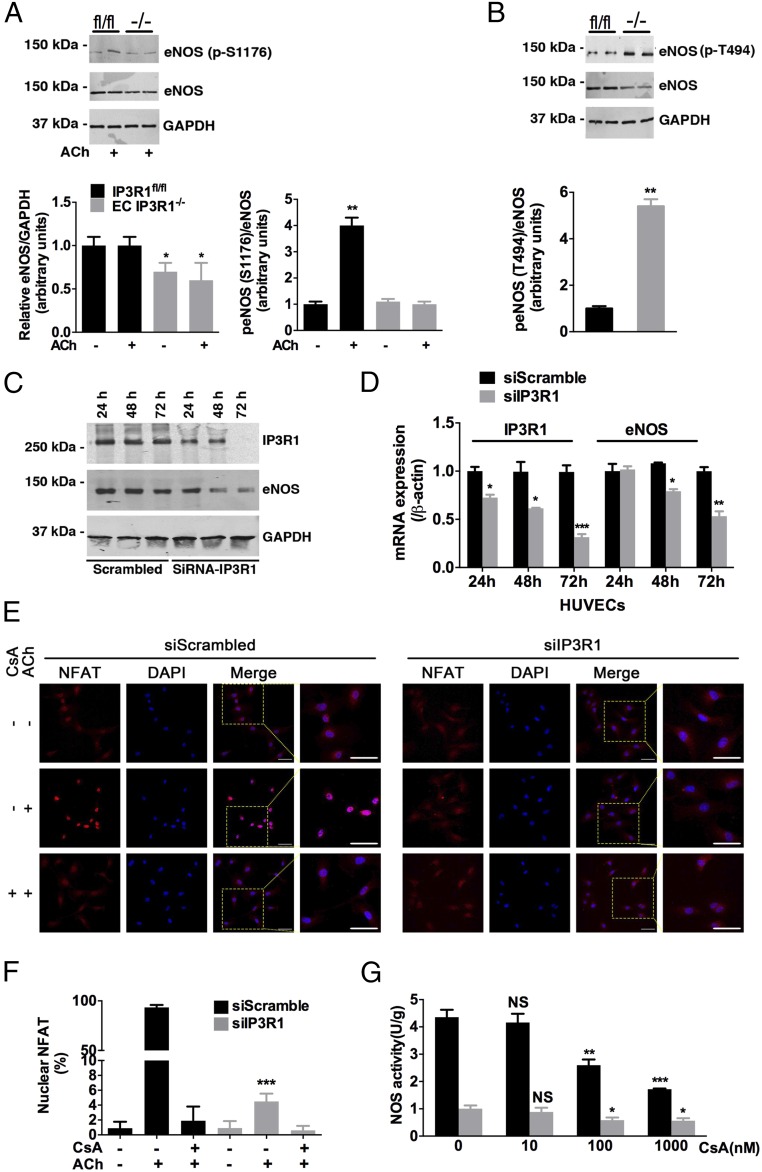
Fig. 3.
Calcineurin in eNOS regulation. (A) Expression of eNOS and phosphorylation of eNOS at Ser1176 (p-S1176) in lysates from mesenteric arteries prepared under basal conditions or after 30-min ACh incubation in IP3R1fl/fl and EC IP3R1−/− mice. The graph shows the densitometric evaluation (n = 3). *P < 0.05; **P < 0.01. (B) Phosphorylation of eNOS at Thr494 (p-T494) in lysates from mesenteric arteries in IP3R1fl/fl and EC IP3R1−/− mice. Data are presented as mean ± SEM of three independent experiments. **P < 0.01. (C) Immunoblots conducted in HUVECs transfected with scrambled or IP3R1-specific siRNAs. Cells were harvested 24 h, 48 h, and 72 h after transfection. (D) Relative IP3R1 and eNOS mRNA levels were measured by real-time RT-quantitative PCR in HUVECs after indicated times of transfection. β-Actin was used as an internal control. (A–D) *P < 0.05; **P < 0.01; ***P < 0.001 vs. scrambled by Student’s t test. (E) Representative immunofluorescence images of NFAT intracellular localization in transfected HUVECs, with or without CsA (1 μM, 1 h) and ACh (10 μM, 10 min) treatment. NFAT, red; DAPI, blue. (Magnification: 20×.) (Scale bars: 20 μm.) (F) Quantification of cells with nuclear-translocated NFAT. More than 30 cells were calculated for each condition, and data are presented as mean ± SEM of three independent experiments. ***P < 0.001 vs. siScrambled treated with ACh only, analyzed by Student’s t test. (G) Isolated aortic ECs were pretreated with gradient concentrations (0, 10, 100, and 1,000 nM) of CsA at 37 °C for 1 h, followed by ACh stimulation and NOS activity measurement as described in Fig. 2E. *P < 0.05; **P < 0.01; ***P < 0.001; NS, not significant vs. 0 nM CsA-treated cells of respective group, analyzed by Student’s t test.

