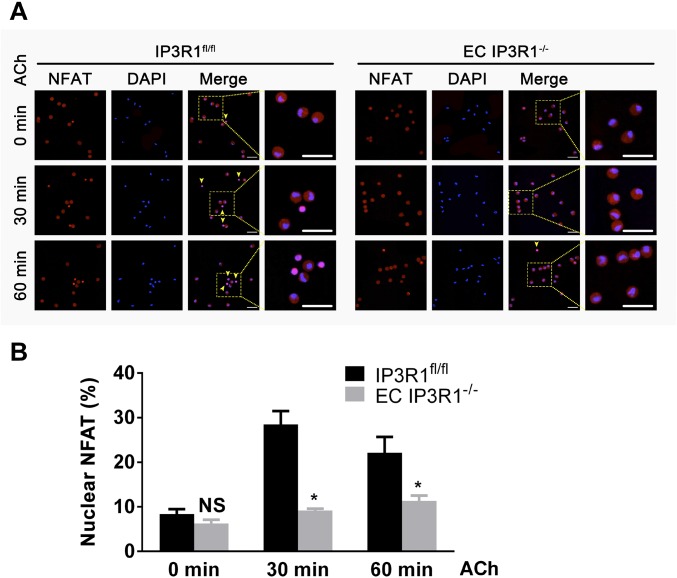
Fig. S8.
NFAT translocation upon ACh stimulation in aortic ECs. (A) Representative immunofluorescence images of NFAT intracellular localization in time-dependent, ACh-treated aortic ECs. Yellow arrowheads indicate ECs with NFAT nuclear translocation. NFAT, red; DAPI, blue. (Magnification: 20×.) (Scale bars: 20 μm.) (B) Data statistics of percentages of cells with nuclear-translocated NFAT (translocated cell number/total cell number * 100%). More than 50 cells were calculated for each condition, and data are presented as mean ± SEM of three independent experiments. *P < 0.05; NS, not significant vs. IP3R1fl/fl ECs within the same group, analyzed by Student’s t test.

