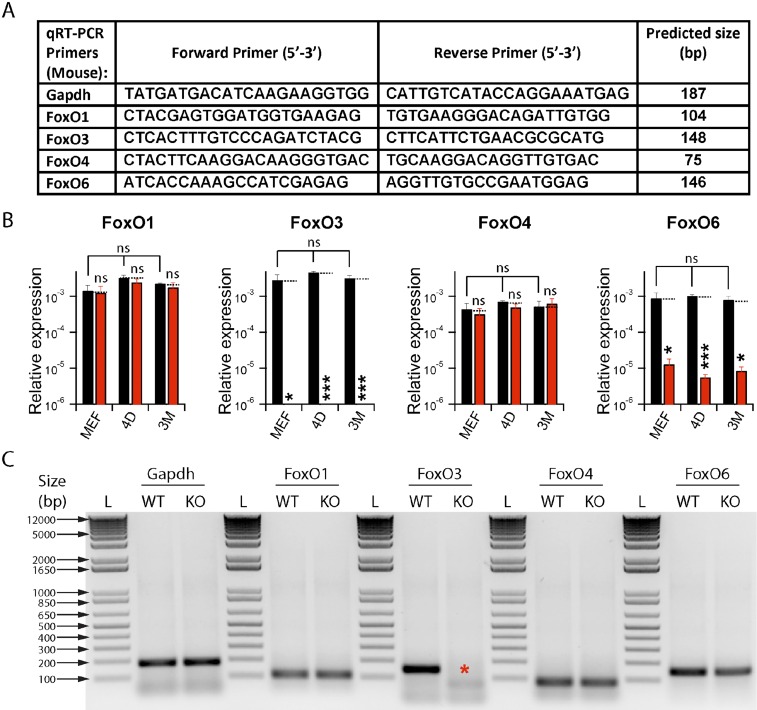
Fig. S4.
Relative expression of FoxO genes in fibroblasts (related to Fig. 4). (A) Table includes primer sequences designed for qRT-PCR assays of corresponding FoxO genes and their predicted product sizes. Gapdh was used as loading control. (B) Relative expression (normalized to Gapdh) values are plotted as means ± SEM (n = 3 independent batches) for FoxO1, FoxO3, FoxO4, and FoxO6 (left to right, respectively), from WT (black) and FoxO3 KO (red) fibroblasts of embryonic (MEF), 4-d-old (4D) and 3-mo-old (3M) animals. Statistical significance (*P < 0.05; ***P < 0.005; ns; P > 0.05) between WT and KO conditions (dotted lines, black) were performed by using unpaired, one-tailed, Student’s t test. (C) The qRT-PCR products of WT and FoxO3 KO MEFs from B were run on 1% agarose gel, which generated single bands for each primer pair (Gapdh, FoxO1, FoxO3, FoxO4, and FoxO6; from left to right, respectively) comparable with their sizes predicted in A. Asterisk (red) in FoxO3 KO condition indicates loss of FoxO3 transcript. L, 1Kb+ ladder (Life Technologies).

