Fig. 1.
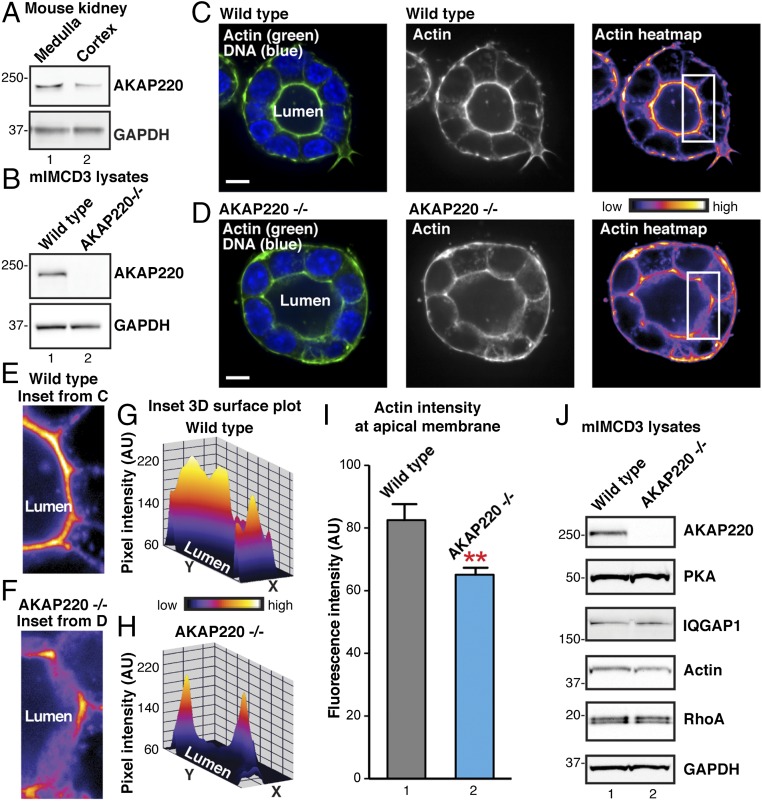
Deletion of AKAP220 disrupts apical actin structures in mIMCD3 spheroids. (A) Western blots of AKAP220 (Top) and GAPDH (Bottom) in the medulla and cortex of the mouse kidney. (B) Western blots of AKAP220 (Top) and GAPDH (Bottom) in WT and gene-edited AKAP220−/− mIMCD3 cells. (C and D) Fluorescent staining of F-actin (Alexa 488 phalloidin; green) and DNA (DAPI; blue) in 3D cultured spheroids grown from (C) WT or (D) AKAP220−/− mIMCD3 (Left). (Scale bars: 10 µm.) Lumena are indicated. Accumulation of actin signal at the apical membranes of luminal cells is shown in grayscale (Middle) and pseudocolor heat-map images (Left). Boxes (Inset) indicate ROIs in E–I. (E and F) Magnified heat-map inset images from regions indicated in C and D highlight actin signal at apical membranes in WT mIMCD3 (E) and AKAP220−/− (F) spheroids. (G and H) Heat-map 3D surface plots of insets (E and F) show differences in F-actin networks at apical membranes of WT and AKAP220−/− spheroids. (I) F-actin fluorescence intensity within 1-µm ROI at apical membranes of individual spheroid cells (n ≥ 26 cells per replicate; n = 3 replicate experiments; P = 0.0025, unpaired t test). (J) Western blot analysis of PKA, IQGAP1, actin, and RhoA in WT mIMCD3 (lane 1) and AKAP220−/− cells (lane 2). GAPDH staining is shown as loading control.

