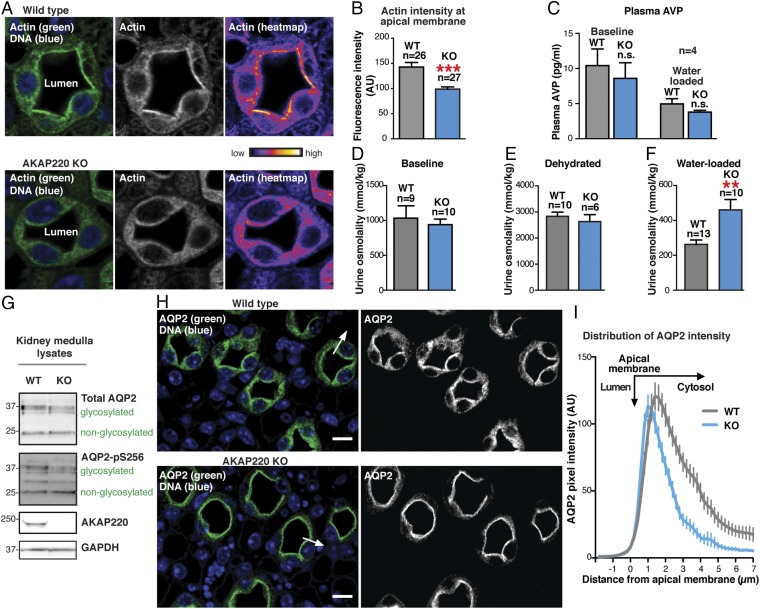
Fig. 4.
Apical actin is disrupted in AKAP220-KO collecting duct cells. (A) Immunofluorescent staining of F-actin (green) and DNA (DAPI; blue) in kidney-collecting ducts from water-loaded WT (Top) and KO (Bottom) mice. Actin accumulation in luminal cells is shown (grayscale, Middle; pseudocolor heat map, Right). (B) Quantification of F-actin fluorescence intensity within 1-µm ROI of apical membranes of luminal cells. N-values and statistical significance are shown. (C) Plasma vasopressin (i.e., AVP) levels are shown for baseline (ad libitum water access) and water-loaded WT (gray) and AKAP220-KO (blue) mice (n = 4). (D–F) Urine osmolality from baseline, dehydrated (24 h), or water-loaded animals. N-values and statistical significance are shown. (G) Western-blot analysis of total AQP2 (Top) and AQP2 phospho-Ser256 (pS256-AQP2; Upper Middle) in kidney medulla lysates from WT and KO mice. AKAP220 (Lower Middle) and GAPDH (Bottom) are shown. Glycosylated and nonglycosylated AQP2 are indicated. (H, Left) Kidney sections from water-loaded WT and KO mice immunostained for AQP2 (green) and DNA (DAPI; blue). (Scale bar: 25 µm.) (H, Right) AQP2 immunostaining in grayscale. (I) AQP2 distribution along the arrow in H from WT (gray) and KO (blue) mice. AQP2 accumulation by line-plot analysis of fluorescence intensity. Narrowed peak indicates increased apical membrane localization.

