Fig. 5.
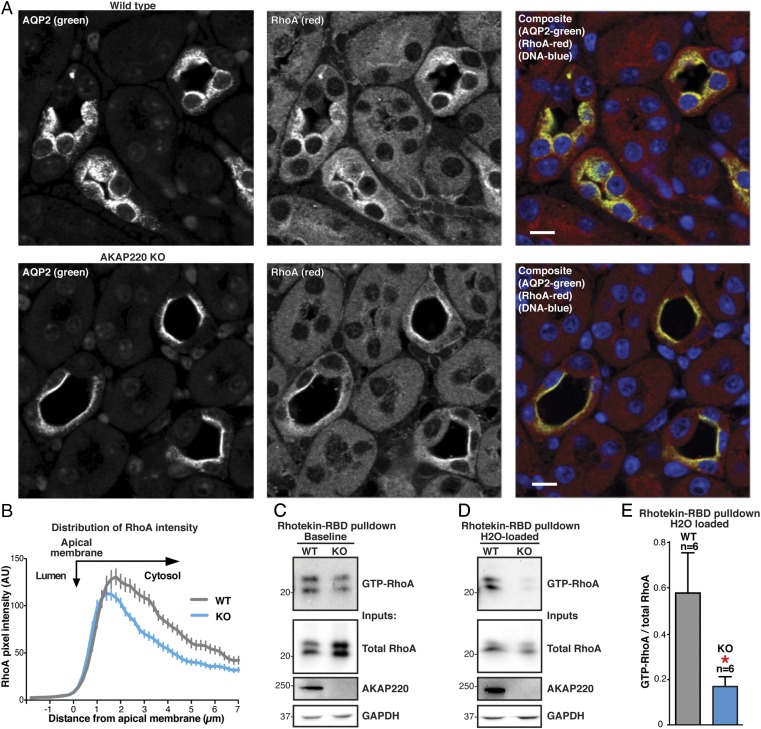
AKAP220-KO kidneys have decreased active, GTP-bound RhoA. (A) Immunostaining of kidney sections from water-loaded WT (Top) and AKAP220-KO (Bottom) mice to detect AQP2 (Left) and RhoA (Middle) in composite with DNA (DAPI; blue). (Scale bar: 25 µm.) (B) Line-plot analysis of RhoA fluorescence intensity in A along a line from the interior of the lumen, across the apical membrane, and into the cytoplasm of the luminal cells. Traces from WT (gray) and AKAP220-KO (blue) sections were quantified. A more narrowed peak is indicative of increased apical membrane localization. Distance from the edge of the apical membrane is measured in microns. (C and D) Rhotekin-RBD beads were used to isolate GTP-bound RhoA from animals given ad libitum water access (baseline; C) and water-loaded animals (D). (Top) Western-blot analysis of GTP-RhoA levels in kidney medulla lysates from WT (lane 1) and AKAP220-KO animals (lane 2). Total RhoA (Upper Middle), AKAP220 (Lower Middle), and GAPDH controls (Bottom) are shown. (E) Quantification of amalgamated data from six Rhotekin-RBD pull-downs. Inputs and pull-downs were run on the same blot and probed for RhoA. Signal intensity for GTP-RhoA (pull-down) was measured and normalized to total RhoA (input) for each sample. AKAP220-KO samples had a significantly lower ratio of GTP-RhoA to total RhoA (P = 0.047, two-tailed Student t test).

