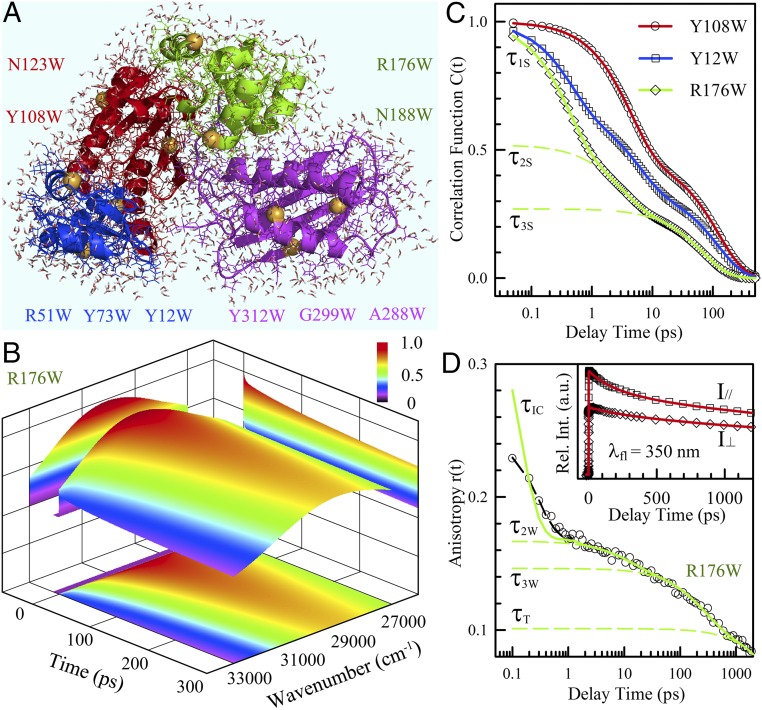
Fig. 1.
Hydration dynamics and protein side-chain motions detected by tryptophan. (A) A snapshot of MD simulations of solvated Dpo4 (Protein Data Bank ID 2RDI) shown with water molecules within 5 Å to the protein surface. Dpo4 consists of four domains, including thumb (green), palm (red), finger (blue), and little finger (magenta). The yellow spheres indicate the mutation sites replaced by tryptophan. (B) Constructed 3D FRES of tryptophan (R176W) at room temperature. (C) Typical solvation correlation functions of three mutants show the very different dynamics when the probe moves from the buried (Y108W) to exposed (R176W) locations. The symbols are the derived experimental data, and the solid lines are exponential fit. The dashed lines represent three exponential decay components (τ1S, τ2S, and τ3S) for the mutant R176W. (D) The anisotropy decay dynamics show four decay components corresponding to internal conversion (τIC), wobbling (τ2W, τ3W), and tumbling (τT) motions. The symbols are experimental data and the dashed black line is the best fit with the internal conversion model (13), and the solid line is after deconvolution from the instrument response. (Inset) Two parallel and perpendicular fluorescence transients used to calculate the anisotropy decay.

