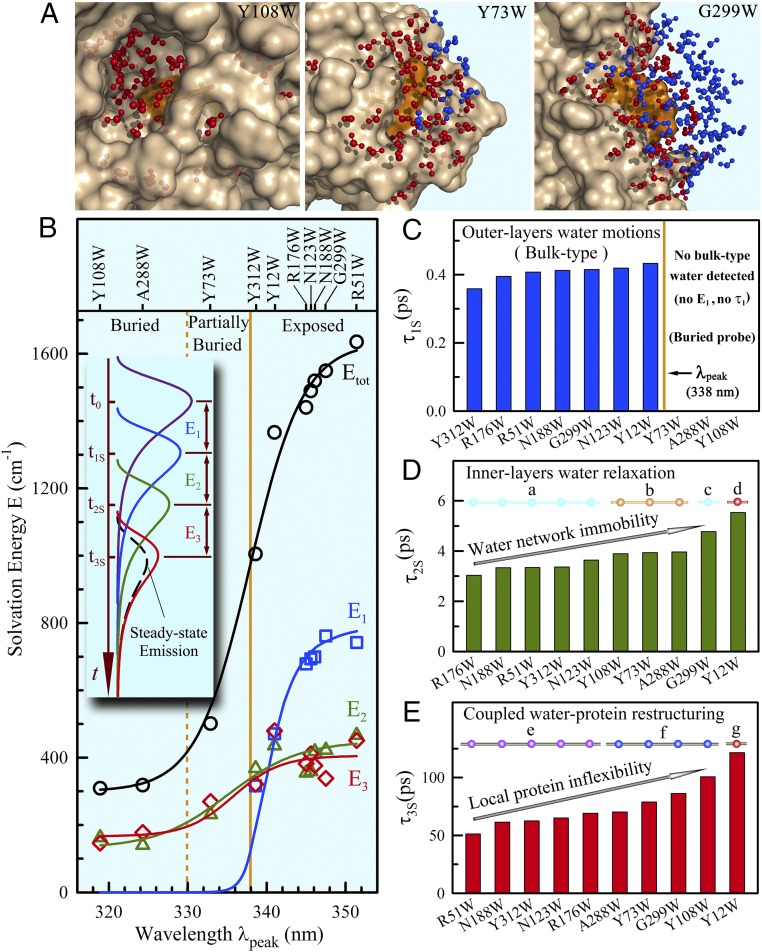
Fig. 2.
Solvation dynamics of hydration water around the protein surface at 20 °C. (A) Total water molecules within 10 Å to the tryptophan indole ring, separated 5 Å (red) and 5–10 Å (blue) to the protein surface from the buried, to partially buried, and finally to exposed positions from a snapshot of MD simulations. (B) The solvation energy distributions (E1, E2, E3, and the total Etot) of 10 mutants at 20 °C relative to the steady-state emission peaks. The solid lines provide only guidelines for the overall increasing trends. (Inset) Schematic plot displaying the evolution of the emission spectrum by solvation. (C–E) Shown are the solvation relaxation times. The three buried probes did not detect ultrafast component (τ1S and E1). For τ2S and τ3S, the times are strongly correlated with the local chemical identities (a, partial charge; c, dense charge), probe distance (b), topological geometry (d and g), and higher-order structures and tertiary intraprotein interactions (e and f) with the wide heterogeneous dynamics around the protein surface.

