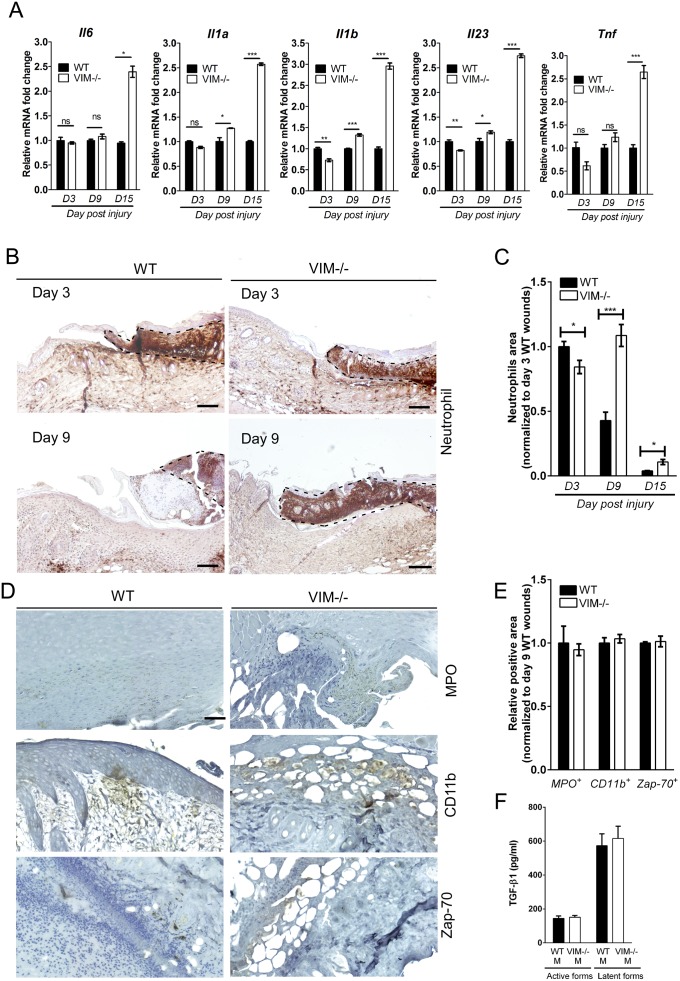
Fig. S4.
Inflammatory cytokines and infiltrated inflammatory cells in wounds in WT and VIM−/− mice (related to Fig. 4). (A) qRT-PCR analysis of transcripts for IL-6 (Il6), IL-1α (Il1a), IL-1β (Il1b), IL-23 (Il23), and TNF-α (Tnf) in wounds in VIM−/− and WT mice on days 3 (D3), 9 (D9), and 15 (D15) after wounding. Data are shown as means ± SEM; n = 3. (B) Representative pictures of immunohistochemical labeling of mouse neutrophils in wounds in VIM−/− and WT mice on days 3 and 9 postinjury. The inflamed tissue is indicated by black dashed lines. (Scale bars, 20 mm.) (C) Comparison of the temporal regulation of inflammation (the wound-edge regions infiltrated with neutrophils) in wounds in VIM−/− and WT mice. Data are shown as means ± SEM; n = 3. (D and E) Representative pictures (D) and quantitative comparison (E) of the myeloperoxidase activity of neutrophils (MPO), monocyte/macrophage marker CD11b, and T-cell marker Zap-70 in the wound-edge regions of wounds in VIM−/− and WT mice 9 d after injury. (Scale bar, 100 μm.) Data in E are shown as mean ± SEM; n = 3. (F) Level of active and latent forms of TGF-β1 in the supernatants after 6 d of WT and VIM−/− macrophage cell culture were analyzed by ELISA. Data are shown as means ± SEM; n = 5. *P < 0.05; **P < 0.01; ***P < 0.001; ns, not significant.

