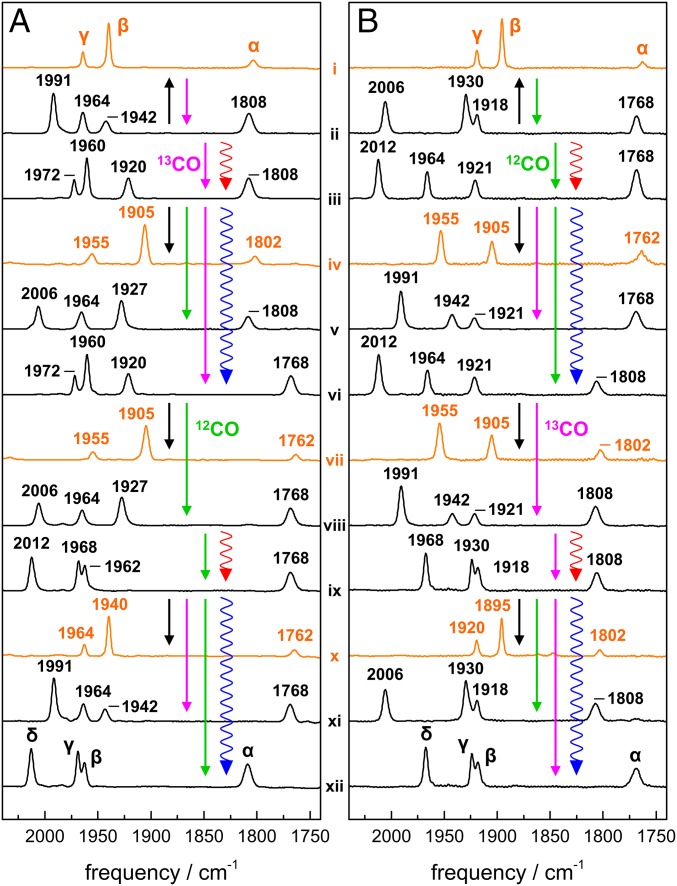
Fig. 2.
ATR-FTIR spectra of HYDA1 [FeFe]-hydrogenase films. (A) Isotopic species with a p12CO ligand. (B) Isotopic species with a p13CO ligand. IR bands due to stretching vibrations of CO ligands at the H-cluster were normalized to unity area sums. Spectra are attributed to Hox (orange) or Hox-CO (black); CO bands are denoted α, β, γ, and δ. For real-time ATR-FTIR experiments, see SI Appendix, Fig. S3. Straight arrows denote gas exposures (12CO, green; 13CO, magenta; and N2, black), wiggled arrows denote red or blue light irradiation. Numerals i–xii annotate identified spectral species (Table 1).

