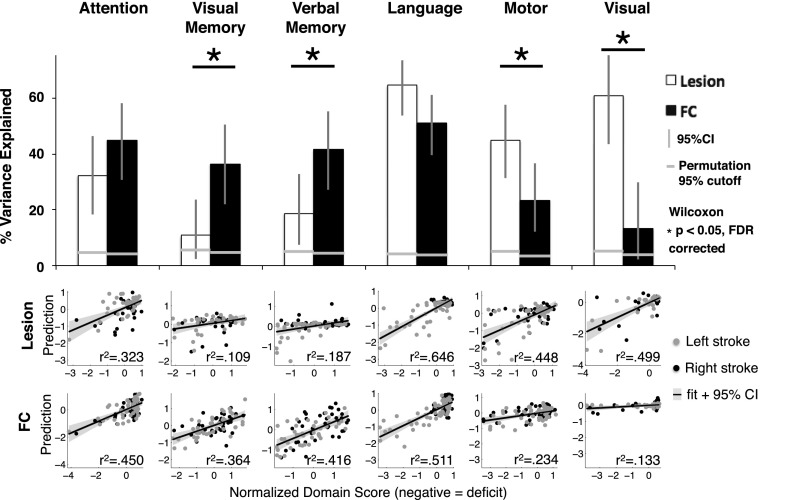
Fig. 3.
Lesion-deficit and FC-deficit model accuracies vary by domain. The bar graph shows percent of variance explained across the six behavioral domains. White bars are lesion-deficit models, black bars are FC-deficit models. Lesion location predicts deficit significantly better in motor and visual domains. FC predicts deficit significantly better in the visual memory, and verbal memory domains. Statistical comparison between lesion-deficit and FC-deficit models (indicated by asterisks) were performed using a Wilcoxon signed rank test of prediction error and were FDR corrected. Horizontal gray lines represent P = 0.05 cutoffs for the null model generated by permuting domain scores 10,000 times for each domain. All models perform significantly better than chance. The scatter plots show the comparison between predicted and measured scores from lesion-deficit models (Upper) and FC-deficit models (Lower). Behavior scores are a composite of multiple tests in each domain and are on a z-normalized (mean = 0, SD = 1) scale. Motor and visual deficits were predicted separately for each hemisphere and the contralateral side, but combined for visualization.

