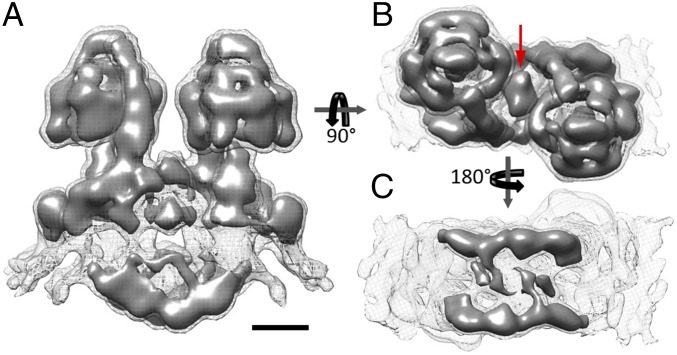
Fig. 1.
Subtomogram average of the mitochondrial ATP synthase dimer from P. tetraurelia. (A) Side view, (B) matrix view, and (C) luminal view. The complex forms a U-shaped dimer with a bulky intracrista region. The red arrow indicates matrix density connecting the two monomers. The average was calculated from 1,244 subvolumes. Threshold levels: mesh, 2 σ; solid, 3.5 σ. (Scale bar, 5 nm.) See Movie S1.

