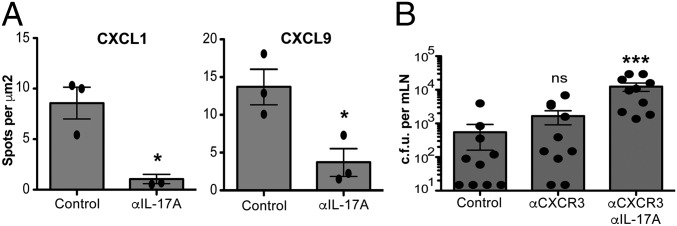
Fig. 6.
CXCL1 and CXL9 are expressed in clusters and CXCR3 drives cluster formation. (A) Numbers of spots per mm2 quantified using Imaris software. Data are expressed as mean ± SEM and analyzed by one-way ANOVA. Data are representative of two independent experiments, n = 3 per group; *P < 0.05. (B) Cfu at 4 dpr after treatment with HRPN + Armenian hamster IgGs (control), CXCR3-173 (αCXCR3), or CXCR3-173 and 17F3 (αCXCR3 + αIL-17A) antibody. Data are expressed as mean ± SEM and analyzed by one-way ANOVA; ***P < 0.001. Data are representative of two independent experiments, n = 7–10 mice per group.

