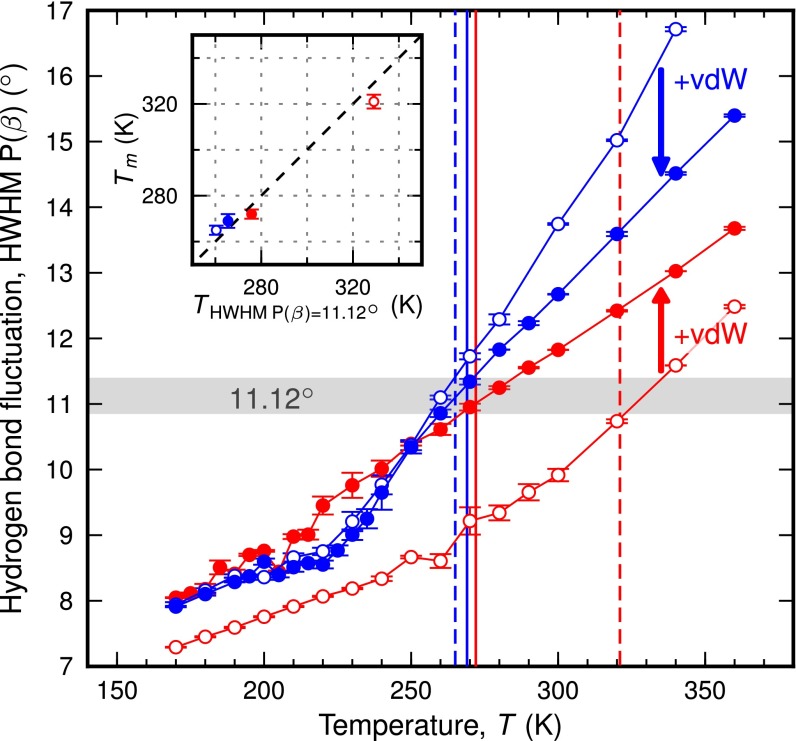
Fig. 4.
HB fluctuation and melting temperature. Fluctuation in the HB angle β, measured by computing the half width at half maximum (HWHM) of the distribution function P(β), as a function of temperature obtained from NNP simulations based on the BLYP (red empty circles), BLYP-vdW (red filled circles), RPBE (blue empty circles), and RPBE-vdW (blue filled circles) density functionals. The vertical lines denote the melting temperature of the respective potentials (solid lines, vdW-corrected potentials; dashed lines, uncorrected potentials). (Inset) Correlation between melting temperature and temperature of an HB fluctuation of 11.12°. The error bars of the melting temperatures were obtained by block averaging.

