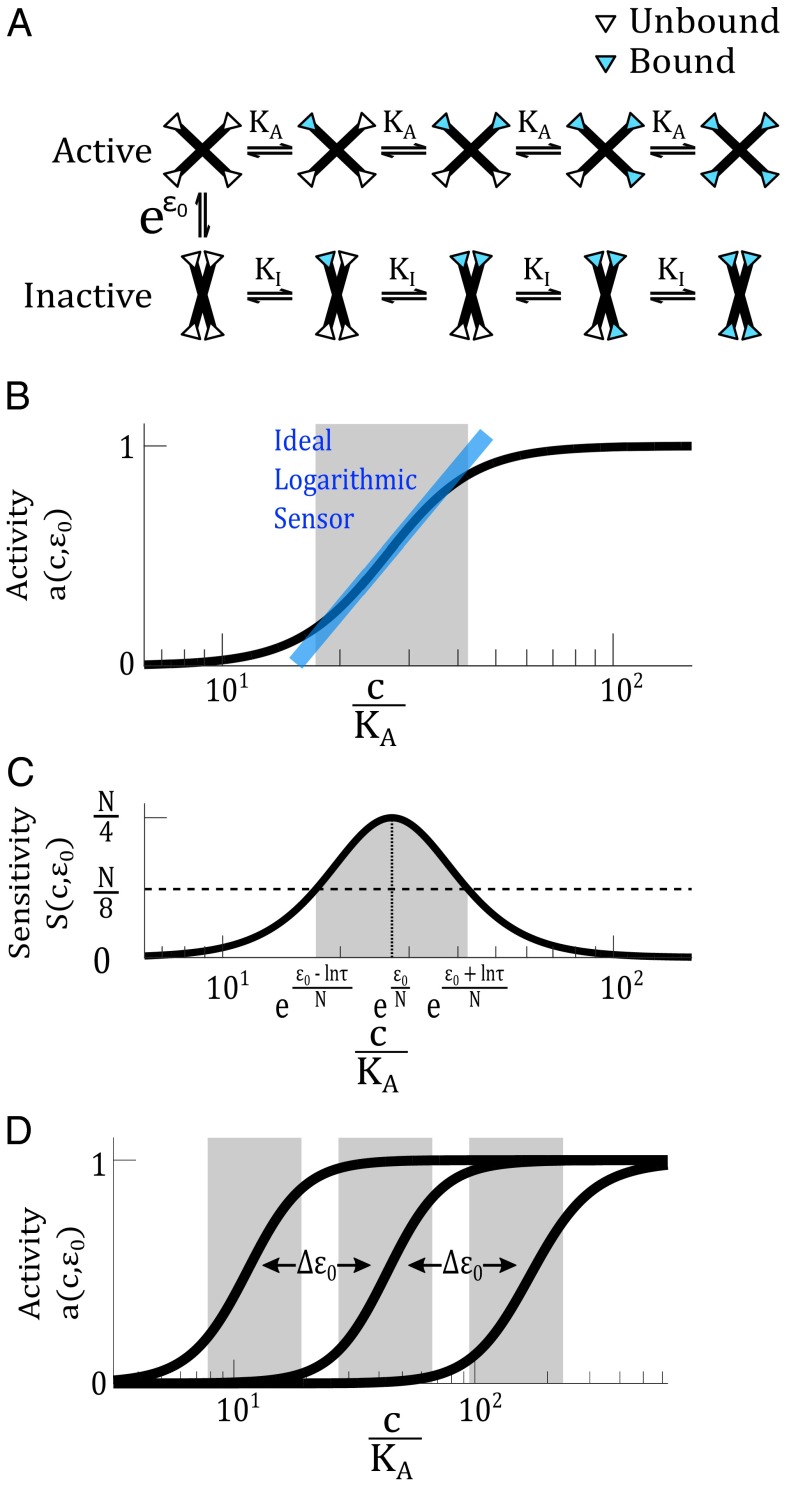
Fig. 2.
An MWC protein can act as a logarithmic sensor. (A) The MWC model describes a protein that can switch between an active and inactive conformation at a rate determined by the allosteric constant . The active state has a ligand-binding affinity and the inactive state has an affinity . The white and blue triangles represent binding sites unoccupied and occupied by ligand, respectively. (B) Within a certain range, activity of the MWC protein, , depends logarithmically on the ligand concentration. The blue line indicates the ideal logarithmic sensor, whose activity directly corresponds to the logarithm of ligand concentration. The gray range indicates the range where activity of the MWC protein coincides with that of the ideal logarithmic sensor with a certain tolerable error. In this illustration, we set the error to be at most 10% (corresponding to in Eq. S9). (C) The sensitivity function is related to the derivative of the activity function, . The sensitivity function allows us to define a range (in gray) where the sensitivity is above a certain threshold. In this illustration, the threshold is set to , corresponding approximately to . In both B and C, we use , , , and . (D) The activity curve of an MWC protein can be tuned on a logarithmic scale, by modulating the allosteric parameter .

