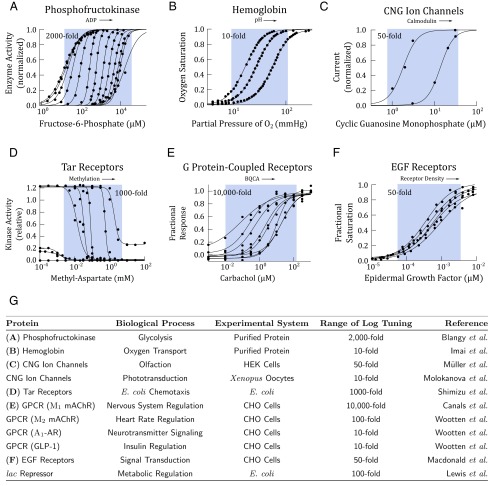
Fig. 5.
Biophysical measurements show that allosteric proteins are logarithmically tunable. In A–F, activity of an allosteric protein is plotted against ligand concentration. Within each plot, each activity curve corresponds to a different level of allosteric modulation. The arrow indicates modulation of the concentration of allosteric effectors. Data points (black circles) were extracted from the original studies using Web Plot Digitizer, except in A and B, where the original data were available. The data were fit with Hill equations using a nonlinear least-square fit in Matlab. The range of logarithmic tuning is defined as the ratio of , which we estimated from the published measurements with empirical values from the Hill equation and is depicted in the blue regions. These regions are meant to be a visual aid to highlight the effects of allosteric regulation and are not analytical. (A) PFK1 is a key enzyme in glycolysis and is allosterically regulated by ADP and ATP. In this study, ADP was varied from 0 to 2 mM (23). (B) Hemoglobin is the primary oxygen transport protein in vertebrates. Hemoglobin is allosterically regulated by blood pH. In this study, pH was varied from 6.6 to 7.8 (26). (C) Cyclic nucleotide-gate ion channels are allosterically modulated by calmodulin. In this study, the ion channels were treated with 0 and 0.5 μM calmodulin (27). (D) The Tar receptor in the Escherichia coli chemotaxis pathway is allosterically regulated by methylation level. In this study, the methylation level was varied through receptor mutants (28). (E) Muscarinic acetylcholine receptors are GPCRs responsible for signaling often found in neurons. The receptors are allosterically regulated by benzyl quinolone carboxylic acid (BQCA). In this study, BQCA was varied from 0 to 10 μM (29). (F) EGFRs are allosterically regulated by receptor density (30). In this study, receptor density was varied by overexpression from to receptors per cell. (G) A table summary of more allosteric proteins, whose measured activity shows logarithmically tuning. When measurements were performed in vivo, the systems were either Chinese hamster ovary (CHO) cells, human embryonic kidney (HEK) cells, Xenopus oocytes, or E. coli. Data for CNG ion channels in phototransduction from ref. 31; data for mAChR, -AR, and GLP-1 GPCRs from ref. 32; and data for the lac repressor from ref. 33.

