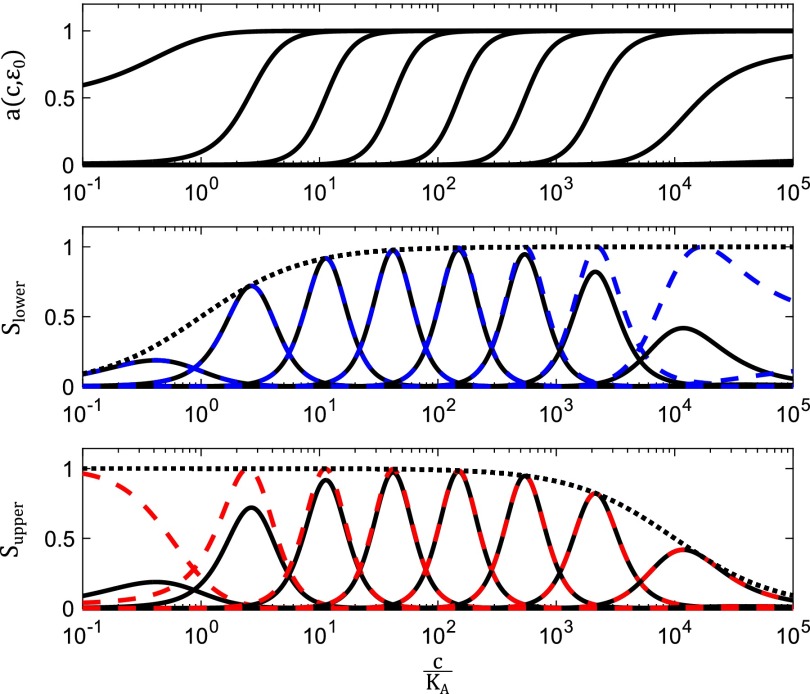
Fig. S2.
Saturation effects in the sensitivity function. (A) Activation curves for the MWC model in Eq. 1, across a full range of ligand concentration, c. The parameters used here are . (B) as c nears lower saturation. The solid black curves are for the same parameters as in A, the dashed blue line is from Eq. S15, and the dotted black line is the scaling function . (C) as c nears upper saturation. The solid black curves are plots of for the same parameters as in A, the dashed red line is from Eq. S16, and the dotted black line is the scaling function .

