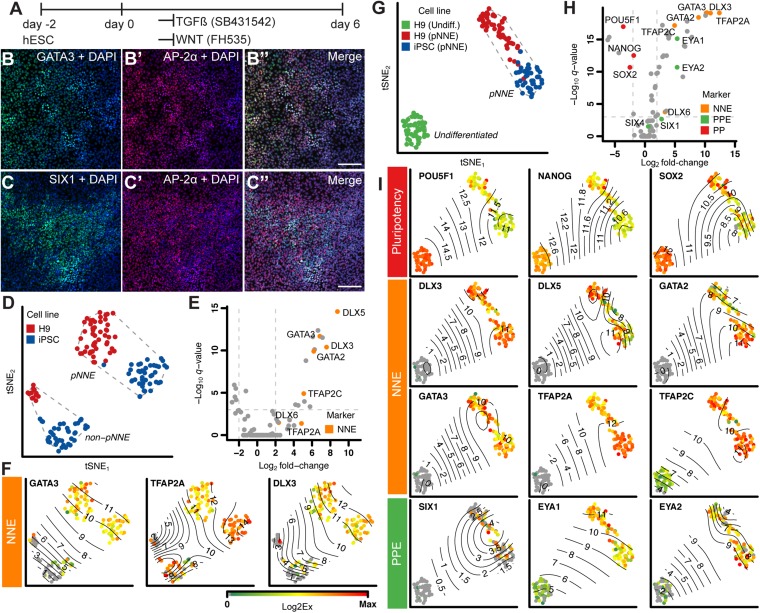
Fig. 2.
Generation of NNE. (A) Monolayer culture conditions. (B and C) Immunocytochemistry of cultures treated for 6 d with TGFβ inhibitor SB431452 and WNT inhibitor FH535 with antibodies to GATA3 [82.8 ± 16.3% (mean ± SD); n = 5, shown in green], AP-2α (69.7 ± 19.1%; n = 7; shown in red), and SIX1 (49.4 ± 13.8%; n = 3, shown in green). DAPI (blue) labels nuclei. (Scale bar, 100 μm.) (D) tSNE-based visualization of pNNE cultures from H9 hESCs (red) and iPSCs (blue) shows a distinct group of responding presumptive (p) NNE and nonresponding cells (non-pNNE). Dashed lines represent the convex hull of the classified cell populations. (E) Volcano plot of genes differentially expressed between pNNE and non-pNNE cells shows NNE marker genes up-regulated in pNNE cells. Dotted lines denote significance level of <10−3 values for multiple-testing corrected Mann-Whitney P value (q value) and fold change of 0.25 and 4. (F) Surface plots of single-cell expression values of selected NNE marker genes projected on the tSNE visualization map. Contour lines highlight the indicated Log2Ex values. (G) tSNE visualization of pNNE cells in relation to hESCs. H9 hESCs: green; H9 pNNE: red; iPSC pNNE: blue. (H) Volcano plot shows NNE marker genes are up-regulated in pNNE cells, and pluripotency markers are expressed in hESCs. (I) Surface plots for select pluripotency, NNE, and PPE marker genes. Color bar values represent dynamic range of Log2Ex values for each gene.

