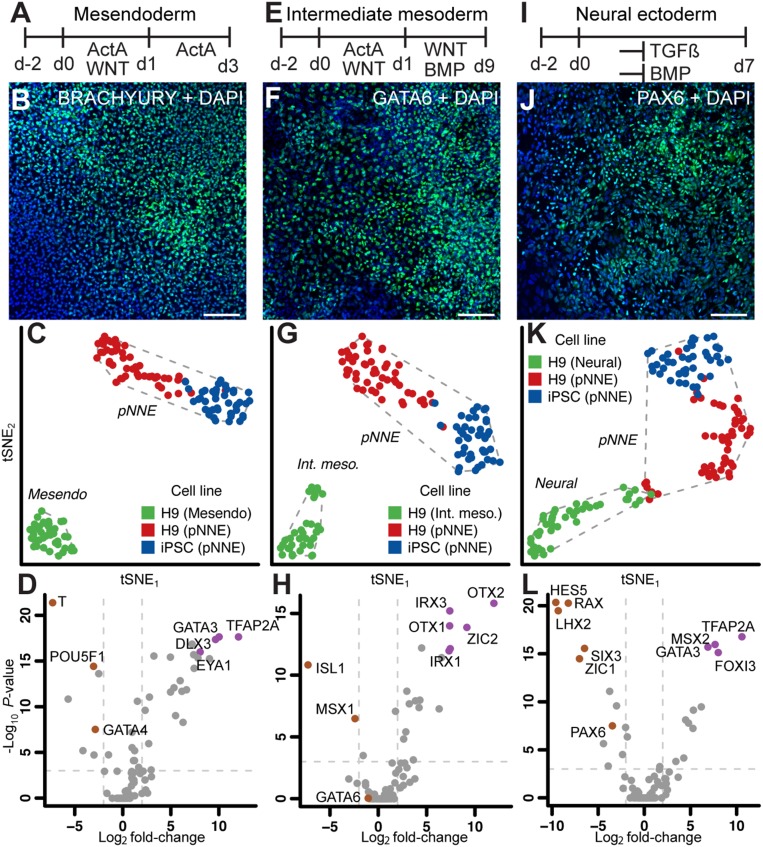
Fig. 3.
Single-cell analysis of pNNE and other in vitro-derived cell types. Single cells of hESC-derived cell types representing mesendoderm (A), intermediate mesoderm (E), and neural ectoderm (I) were compared with pNNE. (Scale bars, 100 μm.) Immunocytochemistry of cultures treated with factors to induce mesendoderm (B), intermediate mesoderm (F), and neural ectoderm (J). tSNE analysis of single cells from pNNE derived from H9 hESCs (blue) and iPSCs (red) and the control cell type (green) representing mesendoderm (C), intermediate mesoderm (G), and neural ectoderm (K). Dashed lines represent the convex hull of the classified cell populations. (D, H, and L) Volcano plot shows population-defining markers for each cell type. Dotted lines denote significance level of <10−3 values for multiple-testing corrected Mann-Whitney P value (q value) and fold change of 0.25 and 4.

