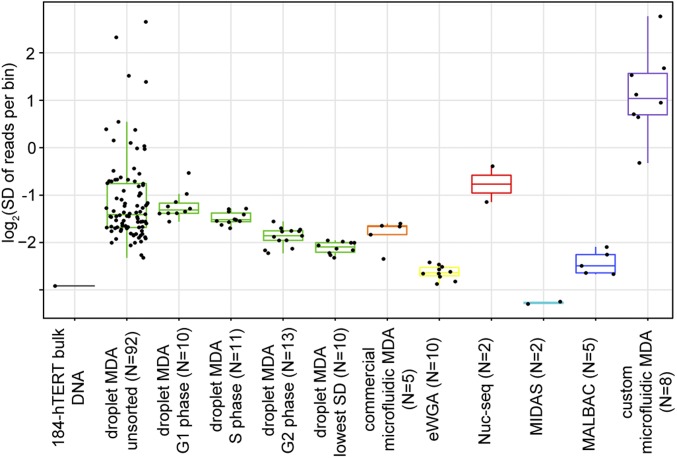
Fig. 2.
Scatterplots and boxplots of SD of reads per 1-Mb bin comparing other published methods with all 184-hTERT single-cell droplet MDA samples sequenced to low depth. Unamplified bulk 184-hTERT gDNA is also included for comparison. Shown for the 184-hTERT single-cell droplet MDA samples are unsorted single cells (with three extreme outliers omitted), single cells FACS-sorted by cell phase (G1, S, and G2), and the 10 samples with the lowest SDs of all sorted and unsorted single cells.

