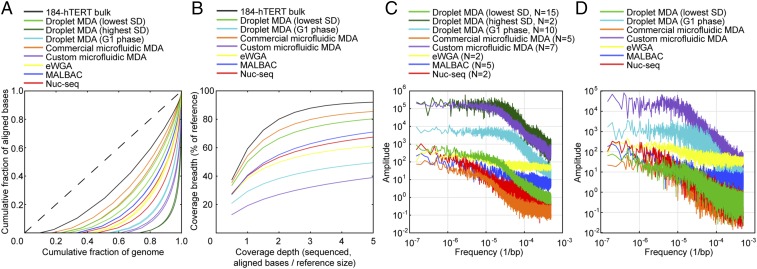
Fig. 4.
Analysis of amplification bias from high-depth WGS. (A) Lorenz curves depicting uniformity of coverage for the two samples with the lowest SD in reads per 1-Mb bin from each amplification method. (B) Coverage breadth as a function of sequencing depth for the sample with the lowest SD in reads per 1-kb bin from each method. (C) Mean power spectra of 1-kb binned read depth for all samples analyzed from each amplification method. (D) Power spectra of 1-kb binned read depth for the sample with the lowest SD in reads per bin from each method.

