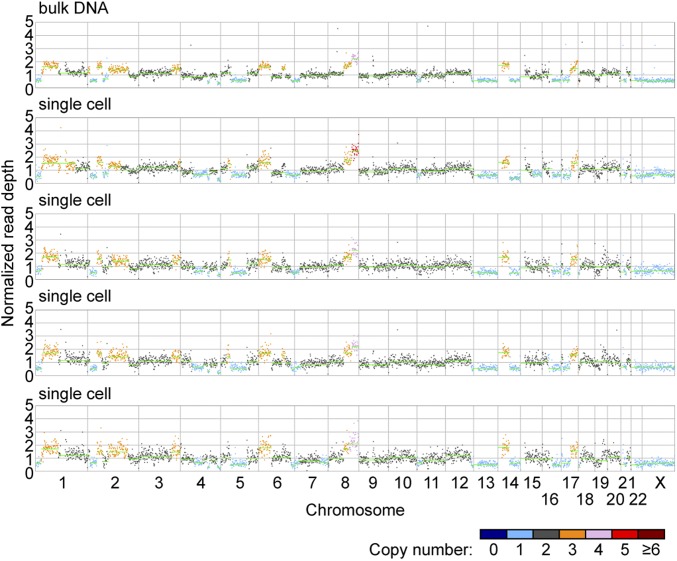
Fig. 5.
Normalized read depth plots using 1-Mb bins for TOV2295 bulk DNA and four single-cell samples. Horizontal green lines indicate segments of contiguous bins inferred to have the same copy number, where the read depth of each segment is equal to the median read depth of the bins in that segment. Inferred copy numbers are indicated by the color of the data point for each bin.

