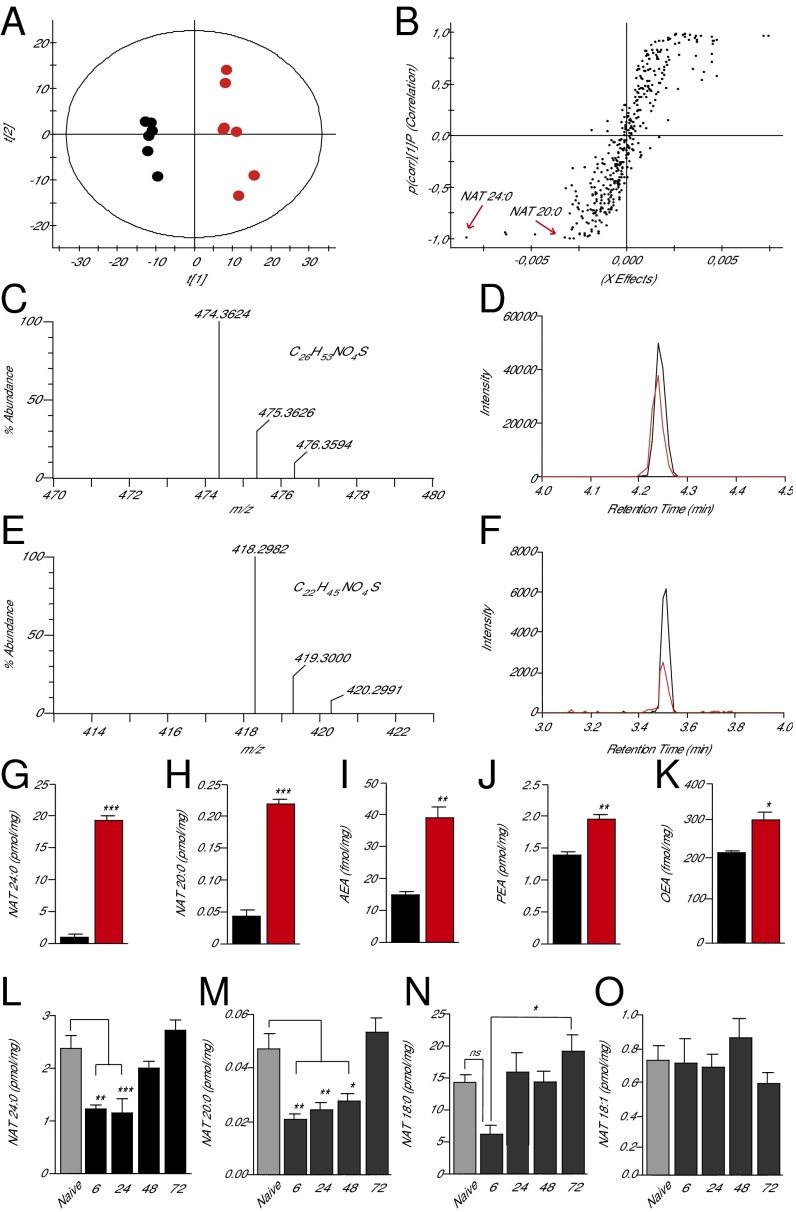
Fig. 4.
Identification of preferred FAAH substrates in mouse skin. (A) Score plot from PCA of skin lipidomics profiles of wild-type mice (black circles) and Faah−/− mice (red circles) acquired in negative-ion mode; t[1] and t[2], principal component 1 and 2, respectively. (B) Sigmoidal plot of OPLS-DA analysis of the negative-ion dataset. Signals strongly contributing to class separation are those found at the bottom left (Faah−/− mice) or top right (wild-type mice) of the plot. Details for each signal are reported in SI Appendix, Table S1. (C–F) High-resolution mass spectra, calculated molecular formulae, and LC/MS tracings for native and synthetic NAT(24:0) (C and D) and NAT(20:0) (E and F). Native compounds are shown in red, authentic standards are shown in black. (G–K) Quantification of NAT(24:0) (G), NAT(20:0) (H), anandamide (AEA) (I), PEA (J), and OEA (K) in skin of wild-type (black bars) and Faah−/− (red bars) mice. (L–O) Time course of changes in the levels of NAT(24:0) (L), NAT(20:0) (M), NAT(18:0) (N), and NAT(18:1) (O) in skin tissue surrounding excision wounds (solid bars) or from unwounded mice (shaded bars). Data are expressed as mean ± SEM (n = 3). *P < 0.05; **P < 0.01; ***P < 0.001 (compared with wild-type mice, two-tailed Student’s t test; n = 5); #P < 0.05 (one-way ANOVA); ns, not significant.

