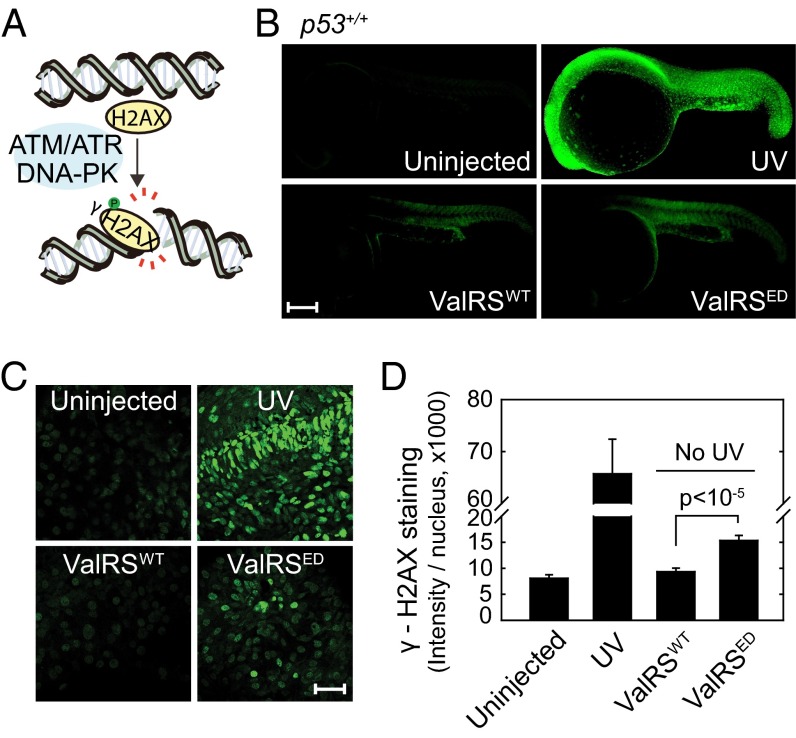
Fig. 2.
Response of H2AX to an ED ValRS. (A) Cartoon of H2AX phosphorylation. (B) γ-H2AX staining in uninjected (n = 60), ValRSWT mRNA injected (n = 65), ValRSED mRNA injected (n = 79), or UV treated zebrafish (n = 30) at 1 dpf. (Scale bar, 250 μm.) (C) Enlarged pictures of γ-H2AX staining in the nuclei of different samples of zebrafish. (Scale bar, 40 μm.) (D) Quantification of γ-H2AX staining. Bars represent mean ± SEM.

