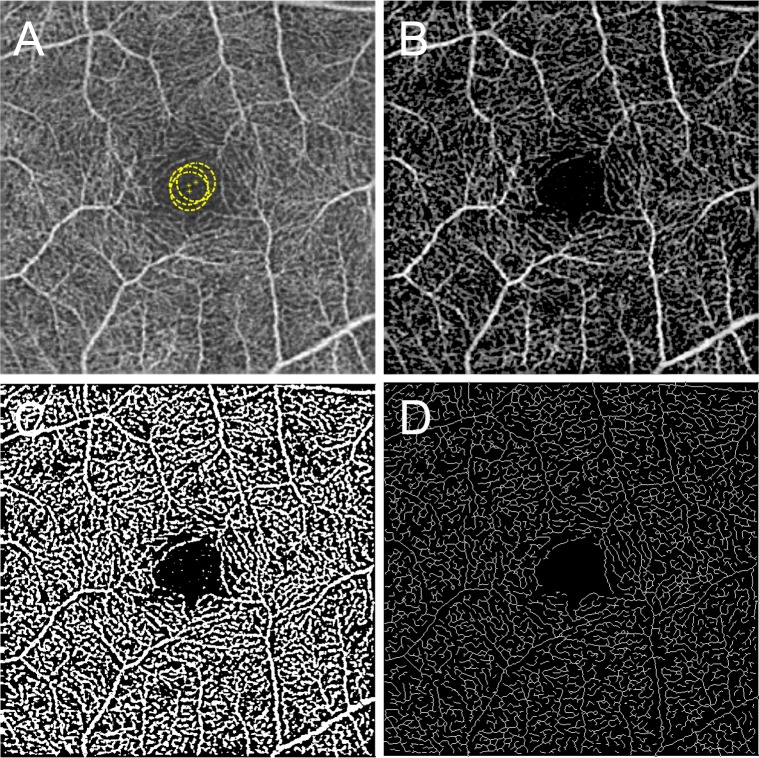
Figure 1.
Representative SD-OCTA and postprocessed images illustrating the semiautomated analysis algorithm. (A) Original, nonsegmented SD-OCTA image. Yellow circles demonstrate the manually selected area that was used as global thresholding. (B) Top-hat filtered image. (C) A binarized image was obtained by using combined adaptive threshold and hessian filter. This image was used for quantification of vessel density. (D) A skeletonized image was obtained by iteratively deleting the pixels in the outer boundary of the binarized image until 1 pixel remained along the width direction of the vessels. This image was used for calculation of skeleton density. The yellow scale bar in (A) shows a distance of 500 μm. This scale applies to (A–D).

