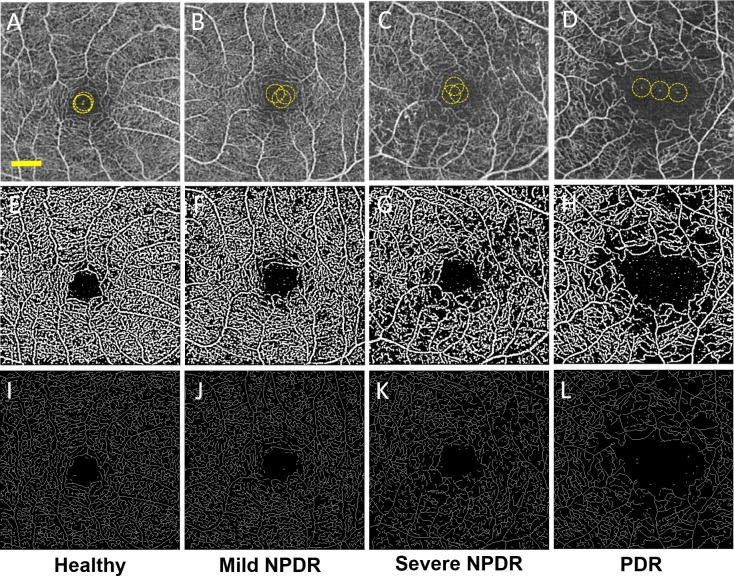
Figure 2.
Nonsegmented SD-OCTA images with quantitative image outputs of representative subjects in 3×3-mm areas around the fovea. En face representations of retinal perfusion can be viewed as (A–D) 2D grayscale SD-OCTA images of retinal vasculature, with selection of noise thresholding marked with yellow in the foveal avascular zone. (E–H) Contrast-enhanced binarized and (I–L) skeletonized images of retinal perfusion around the macula corresponding to the group labeled in each column. The yellow scale bar in (A) shows a distance of 500 μm. This scale applies to (A–L).

