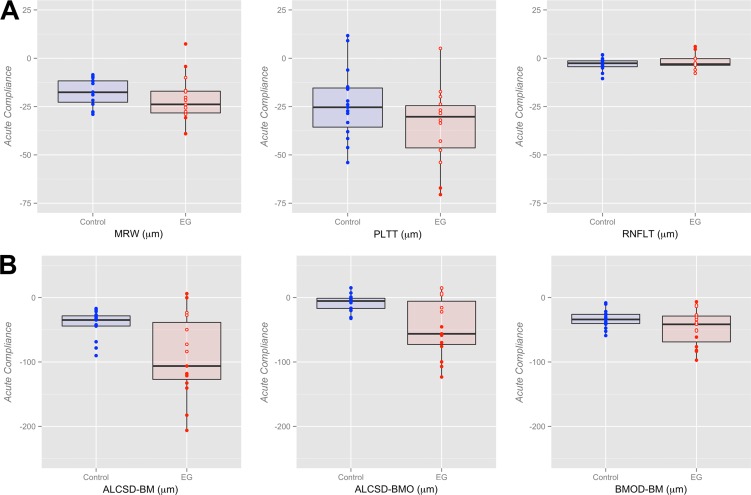
Figure 5.
Box plots representing distributions (median, interquartile range, and extremes) of EG (red) and Control eye (blue) Acute Compliance at EG onset for all OCT neural (A) and connective tissue (B) parameters. The scale extends from −75 to 25 μm across all (A) neural tissue parameters and from −250 to 50 μm across all (B) connective tissue parameters. Experimental glaucoma eyes that fall outside the range of control eye parameters are shown as filled red circles; whereas EG eyes that are within the range of control eye parameters are shown as empty red circles (some circles overlap and appear as one). Eye-specific hypercompliance in EG eyes occurred in MRW (3 of 15 eyes), PLTT (2 of 15 eyes), ALCSD-BM (8 of 15 eyes), ALCSD-BMO (9 of 15 eyes), and BMOD-BM (4 of 15 eyes). An eye-specific decrease in compliance in EG eyes was seen in MRW (two eyes), RNFLT (two eyes), ALCSD-BM (two eyes), and BMOD-BM (one eye).

