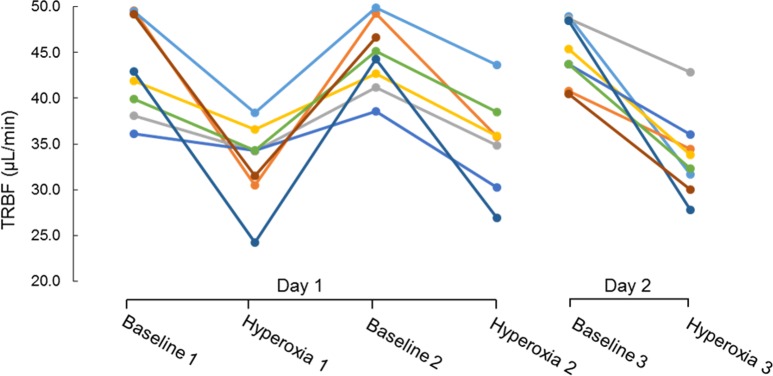
Figure 2.
The average total retinal blood flow (TRFB) for participants (n = 8) under each breathing condition (mean ± SD). Two-tailed t-tests show statistical significant differences between baseline 1 and hyperoxia 1 (P = 0.05), baseline 2 and hyperoxia 2 (P = 0.001), and baseline 3 and hyperoxia 3 (P = 0.002).

