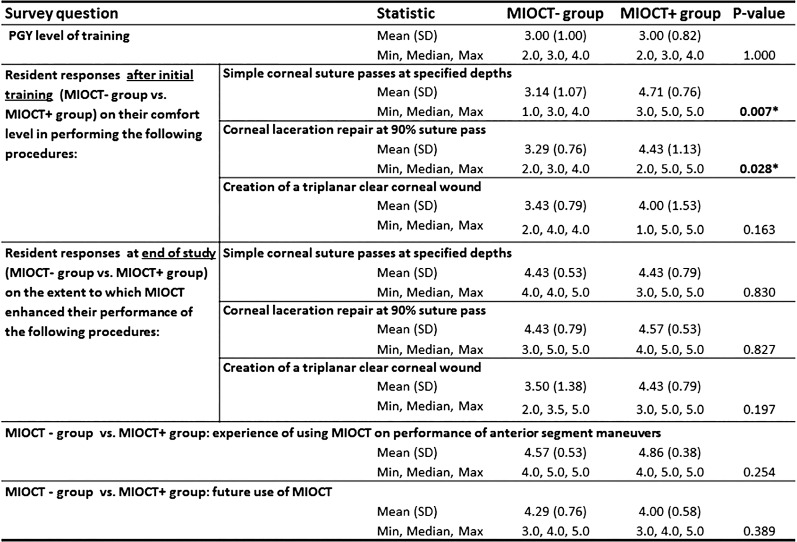
Figure 7.
The survey administered to each resident surgeon at the conclusion of initial training and end of the study ranked their subjective experience on a 1 to 5 numerical scale. The mean subjective score with SD and minimum, maximum, and median responses to the survey questions are summarized below. The comparison between the MI-OCT− group and the MI-OCT+ groups was done using the Wilcoxon rank sum test of difference between medians. Asterisk denotes a statistically significant P value.

