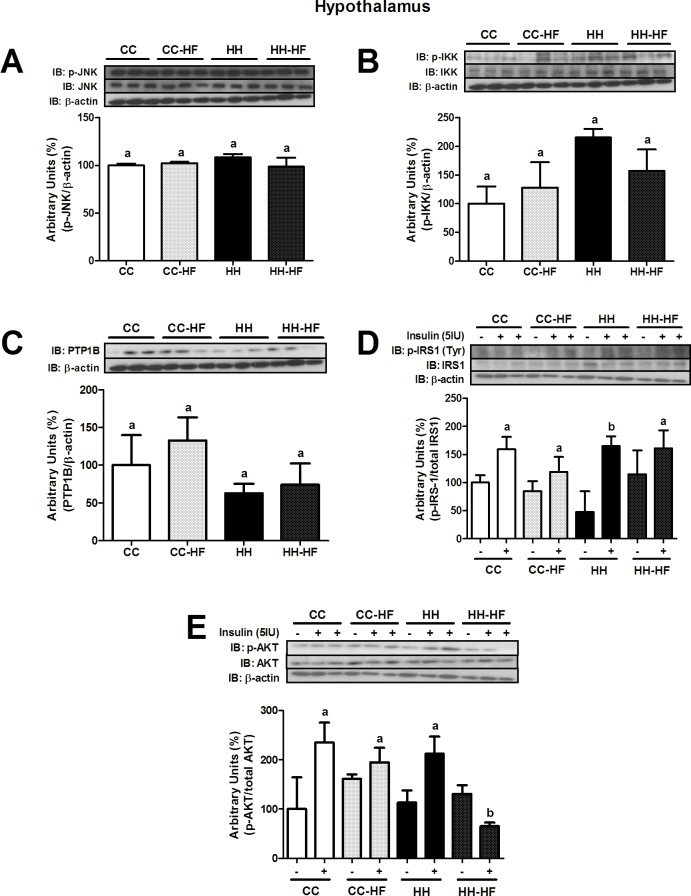
Fig 8. Inflammatory and insulin signalling proteins in hypothalamus at d82.
Western blot analysis of p-JNK (A), p-IKK (B), PTP1B (C), p-IRS1 (D) and p-AKT (E) in the hypothalamus at d82. For control of gel loading, membranes were reblotted with β-actin or total proteins. Data are means ± SEM (n = 3–8). Two-way ANOVA was used. In all blots, at least three different litters were considered. Different letters indicate significant differences at p<0.05.

