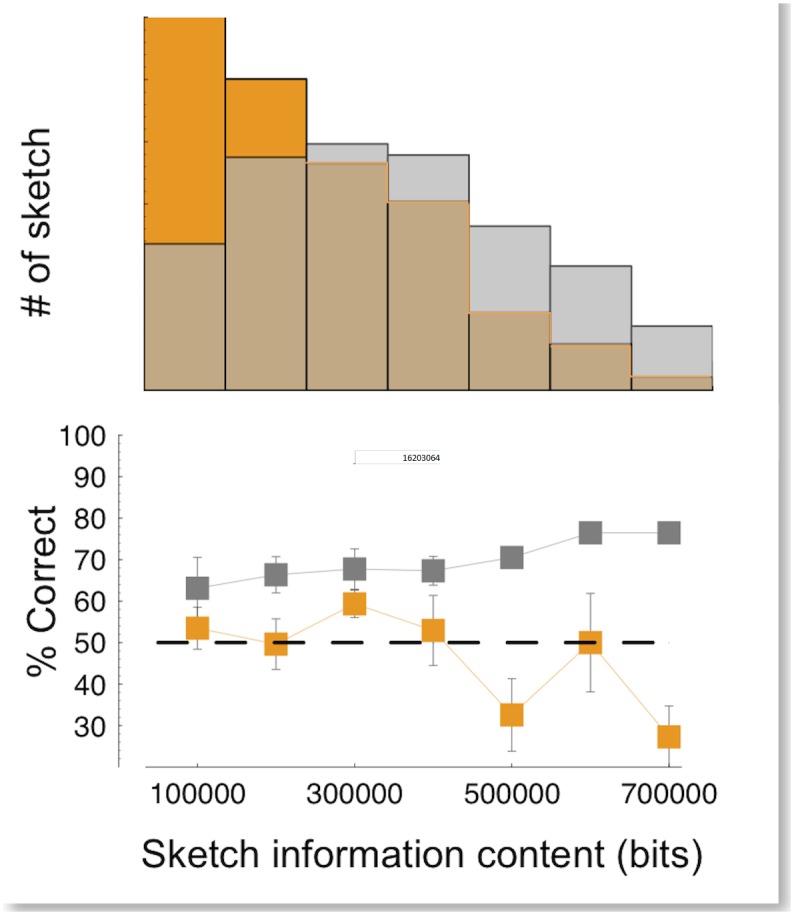
Fig 2. Information content of 1 bit sketches.

Upper panel: distributions of the information content of the 1 bit color (orange) and luminance (gray) sketches. Information of a single sketch, S(i, j), is calculated as , where k (i,j) is the pattern matching the patch centered at pixel (i,j), summed over all the image. The distributions are taken over the entire image database of our study. Lower panel: percentage of correct discrimination, averaged over all subjects, plotted as a function of the information content of the color only (orange) and luminance (gray) sketches, for the same data as in Fig 3. Error bars are SEM. The dashed line represents chance level.
