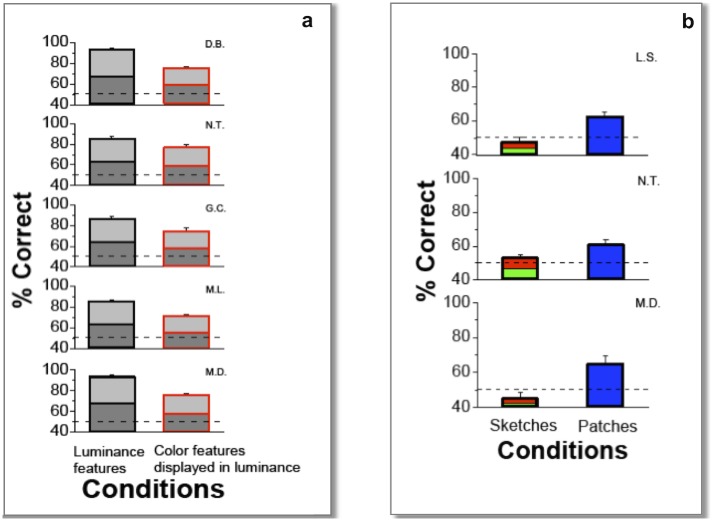
Fig 4.
a) Luminance features vs. color features rendered in luminance. Percentage of correct discrimination of five subjects based on 2 gray-level sketches obtained with 1 bit luminance-only filters (Fig 1b) (black-outlined bars) and 1 bit color-only filters (Fig 1c) rendered in gray-levels (red outlined bars). Plotted values are averages over all trials (300) of the same condition. Errors are binomial s.d. The dashed line represents chance performance. Statistical binomial tests: N.T. and G.C: p< 0.05, D.B., M.L. and M.D. p<0.01. b) Color features vs. color patches. Percentage of correct image discrimination based on equiluminant sketches (2 red/green-levels bars) and percentage correct discrimination of color patches (blue bars). Data collected on three subjects. Plotted values are averages over all trials (300) of the same condition. Errors are binomial s.d. The dashed line represents chance performance. Color patches vs. chance: binomial tests p<0.005 all subjects.

