
Fig 5. Correlations between emotional intelligence (8-week variations) and perceived stress (8-week variations) in each group.
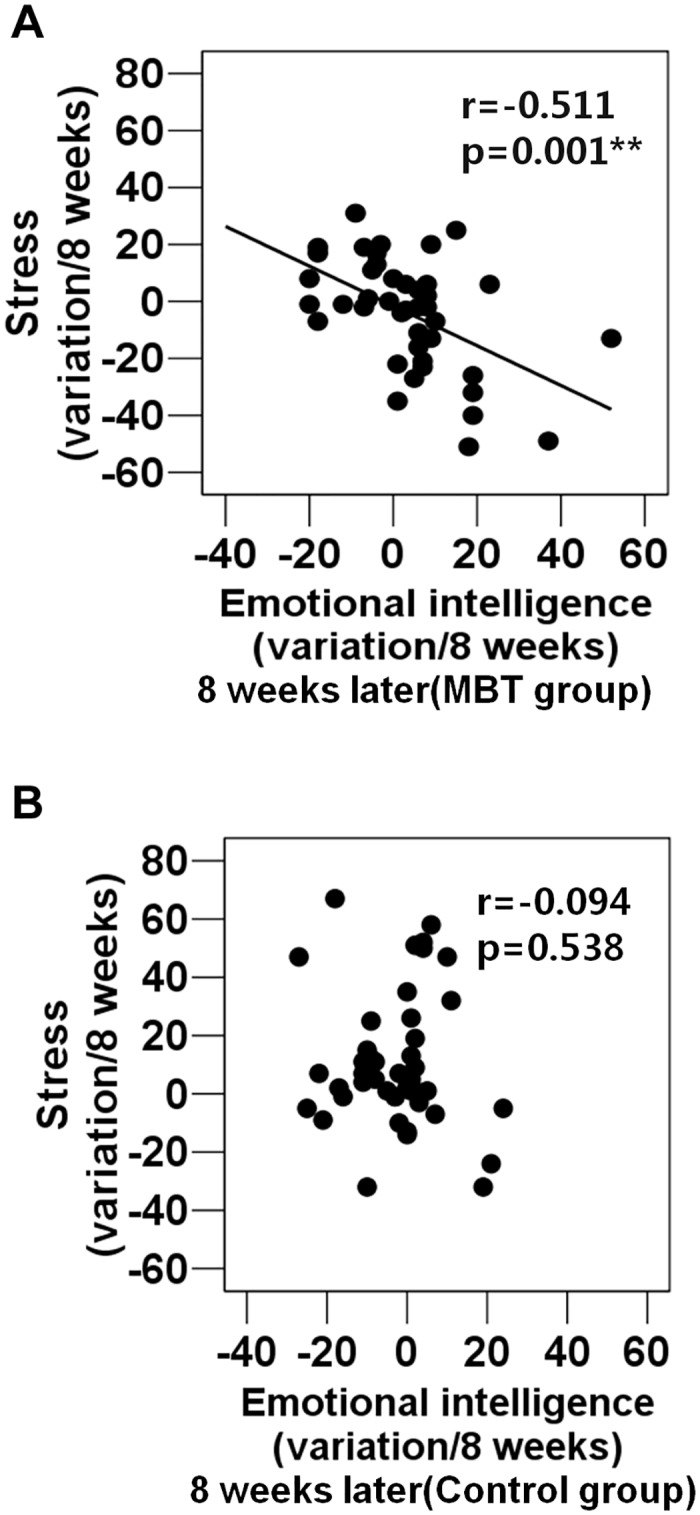
(A) A correlation between emotional intelligence (8-week variations) and perceived stress (8-week variations) in the MBT group. (B) A correlation between emotional intelligence and perceived stress (8-week variations) in the control group.